

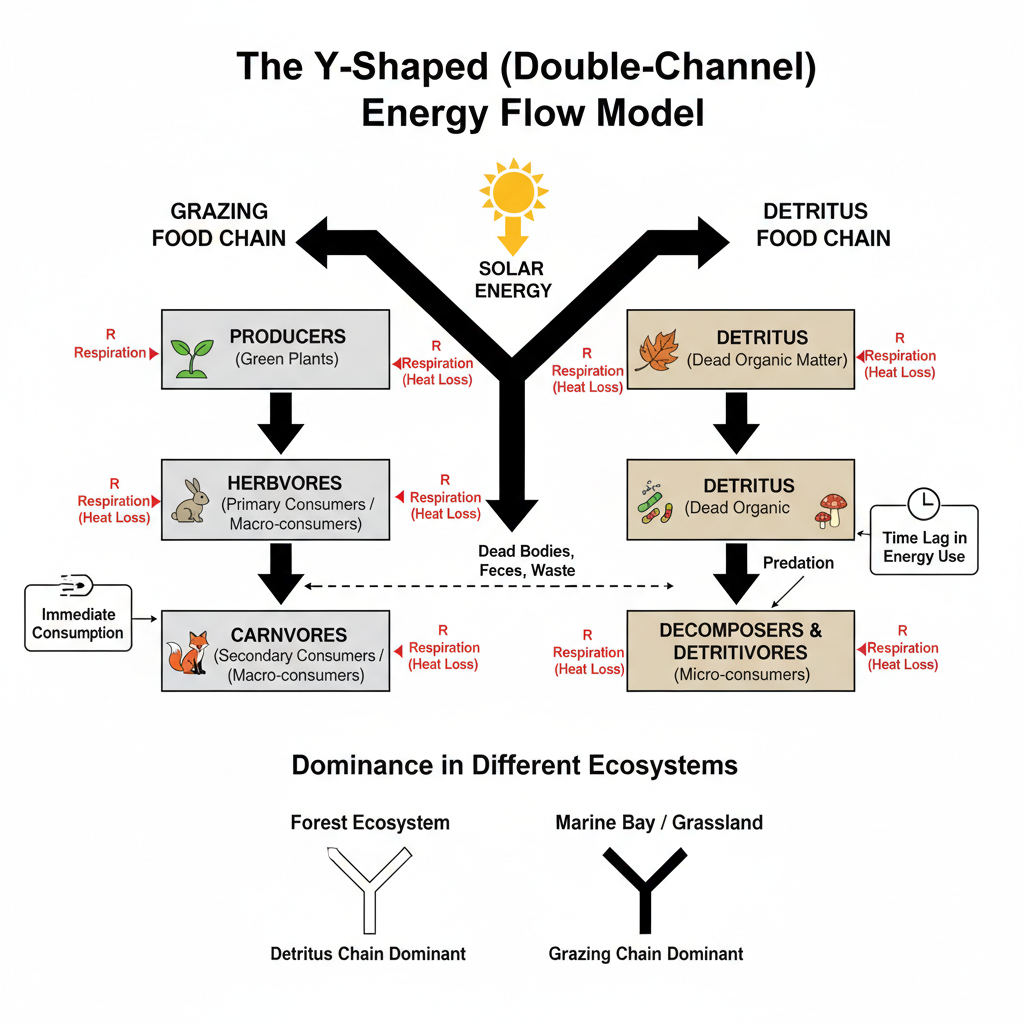
The Y-shaped energy flow model is a double-channel model that represents the flow of energy through two different food chains in an ecosystem. It was first developed by H.T. Odum in 1956 and later generalized by E.P. Odum. The model has a Y-shaped structure because the energy obtained from primary producers is divided into two pathways.
The first pathway is the grazing food chain. In this pathway, energy passes from living green plants to herbivores and then to carnivores. The second pathway is the detritus food chain. Here, energy passes from dead organic matter, plant litter and animal wastes to decomposers and detritivores.
Both pathways are interconnected with each other. Dead plants, dead animals and fecal materials from the grazing pathway enter into the detritus pathway. Similarly, detritivores may be eaten by different predators and energy again enters into the grazing food web.
The Y-shaped energy flow model gives a more natural representation of energy flow in an ecosystem. It shows that all plant energy is not directly consumed by herbivores. In forests and wetlands, about 80% to 90% of the net primary production may enter into the detritus pathway. Thus, the decomposer organisms play an important role in the transfer of energy and recycling of nutrients in the ecosystem.
What Is the Y-Shaped Energy Flow Model?
The Y-shaped energy flow model is a model showing the movement of energy through two different food chains in an ecosystem. It is also referred to as the double-channel energy flow model.
The model appears like the letter Y. The base part is formed by the primary producers such as green plants and algae. From the producers, the energy flow is separated into two pathways.
One pathway is the grazing food chain. In this pathway, the energy passes from living plants to herbivores and then to carnivores.
The other pathway is the detritus food chain. Here, dead plant materials, animal remains and wastes are used by decomposers and detritivores.
The two pathways are not fully separate. Dead organisms and wastes from the grazing food chain enter into the detritus food chain. Some detritivores are also consumed by other animals.
The energy flow in this model is unidirectional. It moves from one trophic level to another trophic level and a part of energy is lost as heat. Energy is not recycled in the ecosystem, but nutrients are again used during nutrient cycling.
Who Proposed the Y-Shaped Model?
The Y-shaped energy flow model was proposed by H.T. Odum in 1956. He developed this model to show the energy flow through two food chain pathways in an ecosystem.
Later, the model was expanded and generalized by E.P. Odum. He explained its application in both terrestrial and aquatic ecosystems.
The model includes the grazing food chain and the detritus food chain. Both pathways operate together and are interconnected with each other.
How the Y-Shaped Energy Flow Model Works
The Y-shaped energy flow model shows the flow of energy through two different pathways in an ecosystem. The solar energy first enters into the ecosystem. It is then fixed by the primary producers.
The producers convert light energy into chemical energy. This energy is stored in their organic materials. After this, the stored energy is divided into the grazing food chain and the detritus food chain.
Entry of Energy Through Primary Producers
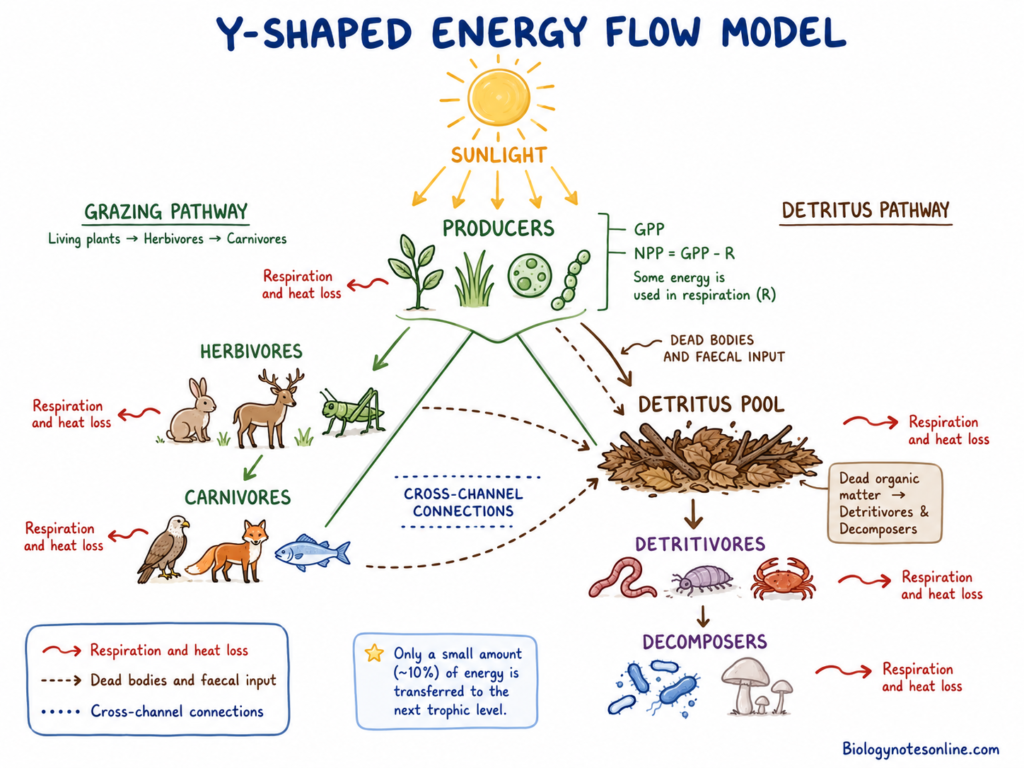
The primary producers form the base of the model. These include green plants, algae and phytoplankton.
They capture solar energy during photosynthesis. The total amount of energy fixed by the producers is called Gross Primary Production (GPP).
A part of this energy is used during respiration and maintenance. The remaining energy is called Net Primary Production (NPP).
NPP = GPP – R
This net energy is available for the grazing pathway and the detritus pathway.
Energy Flow Through the Grazing Food Chain
The grazing food chain starts from the living plant materials. In this pathway, the herbivores directly consume the green plants.
The energy flow is as follows-
Living plants → Herbivores → Carnivores
The energy is first transferred to the herbivores. It is then transferred to the carnivores feeding on them.
This pathway is common in grasslands and open-water ecosystems. In these ecosystems, a major portion of living plant materials is directly consumed by animals.
Energy Flow Through the Detritus Food Chain
The detritus food chain starts from the dead organic matter. It includes fallen leaves, dead organisms, animal remains and faecal materials.
The dead organic materials are used by decomposers and detritivores. Bacteria and fungi are the main decomposers. Earthworms, nematodes and crabs are some common detritivores.
The energy flow is as follows-
Dead organic matter → Decomposers and detritivores → Predators
This pathway is common in forest soil and aquatic sediments. Here, a large part of plant production is not directly consumed by herbivores. It enters into the detritus pathway after the death of plant materials.
Loss of Energy at Each Trophic Transfer
During each energy transfer, a large amount of energy is used in respiration and different metabolic activities. Energy is also used during movement, growth and maintenance of the body.
A part of energy is released into the surroundings as heat. This energy cannot be used again by the ecosystem.
Only a small amount of energy passes to the next trophic level. According to the ten per cent law, about 10% of energy is transferred to the next trophic level. The remaining energy is mostly lost as heat.
How the Grazing and Detritus Pathways Are Connected
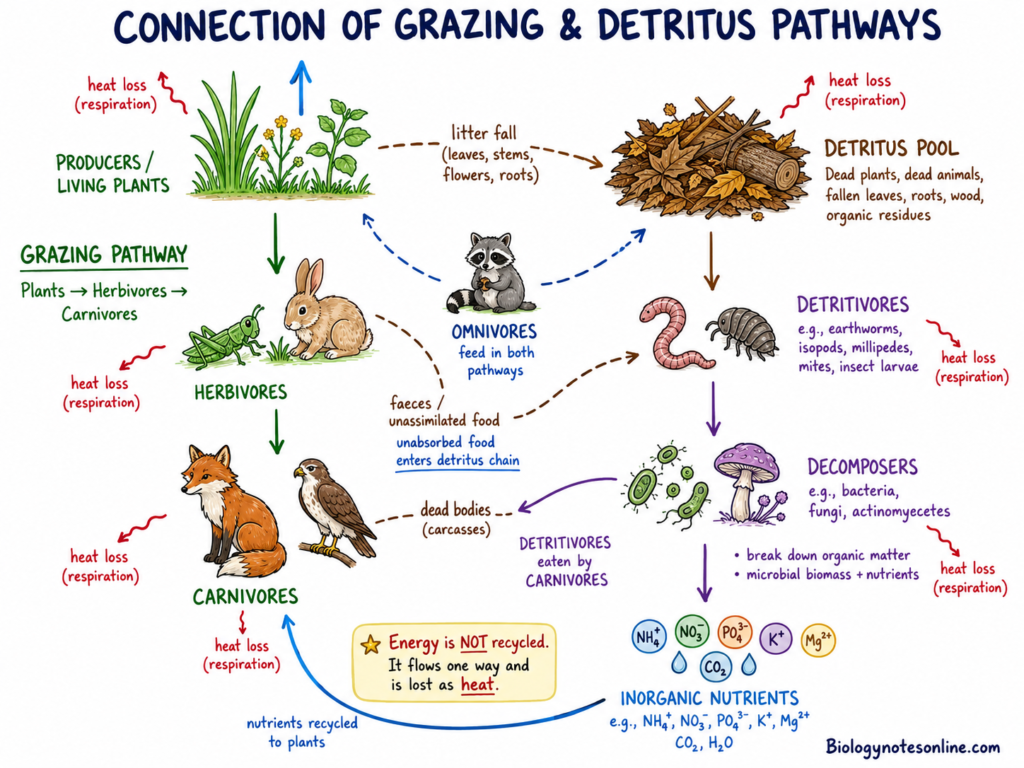
The grazing food chain and the detritus food chain are shown as two different pathways. But both pathways are connected with each other in the natural ecosystem.
The dead organisms of the grazing pathway enter into the detritus pathway. The faeces and undigested food of herbivores also become a part of detritus. Thus, organic matter is continuously transferred from one pathway to another.
Detritivores are sometimes consumed by carnivores. Omnivores can also feed on living plants and dead organic materials. In this way, they may become a part of both pathways.
During decomposition, the organic materials are converted into inorganic nutrients. These nutrients again support the growth of plants. But energy is not recycled. It flows in one direction and is finally lost as heat.
Role of Unassimilated Food and Faecal Material
The food consumed by animals is not completely digested and absorbed. A part of this food remains as unassimilated material.
This material is removed from the body in the form of faeces. It contains organic matter, nutrients and some amount of chemical energy. It then enters directly into the detritus food chain.
In aquatic ecosystems, zooplanktons may consume a large amount of phytoplankton. The unabsorbed food is released as faecal material. This provides food and energy to the decomposers and detritivores.
Role of Death, Litter Fall and Decomposition
Death of plants and animals transfers living biomass into the detritus pool. Litter fall also provides a large amount of dead organic matter.
Fallen leaves, dead roots, wood, dead animals and shed body parts are the common materials entering into this pathway. These materials are accumulated on the soil or sediment surface.
Bacteria, fungi and detritivores begin the decomposition of these organic materials. During this process, the complex organic matter is broken down. Microbial biomass and inorganic nutrients are formed.
Grazing Food Chain Versus Detritus Food Chain
| Comparison Feature | Grazing Food Chain | Detritus Food Chain |
|---|---|---|
| Starting Material | Living plant biomass, green algae, and photosynthetic autotrophs. | Dead organic matter (detritus), including fallen litter, plant debris, animal remains, and fecal waste. |
| First Consumer Group | Herbivores (primary consumers). | Saprotrophic microconsumers (bacteria and fungi) and macroconsumer detritivores. |
| Speed of Energy Availability | Rapid, real-time energy throughput directly tied to active photosynthesis. | Slow, with a pronounced time lag required for senescence, death, leaching, and microbial decay. |
| Direct or Delayed Use | Direct consumption of living plant tissues. | Delayed utilization of organic energy after plant or animal death. |
| Effect on Primary Producers | Herbivores feed directly on living plants, directly influencing plant population size, biomass, and growth. | Decomposers feed on dead remains after mortality, so they cannot directly influence the live plant population or their food supply rate. |
| Dominant Ecosystem Types | Open-water marine ecosystems, pelagic ocean zones, and heavily grazed grasslands. | Forests, salt marshes, mangrove estuaries, and shallow aquatic sediments. |
| Major Organisms | Live plants, zooplankton, grasshoppers, deer, frogs, fish, and carnivores. | Bacteria, fungi, nematodes, earthworms, crabs, snails, and detritivorous predators. |
| Main Ecological Role | Direct transfer of fixed solar energy to higher animal trophic levels. | Breakdown of organic waste, mineralization and recycling of inorganic nutrients, and buffering ecosystem energy flow against seasonal fluctuations. |
Dominant Energy Pathways in Different Ecosystems
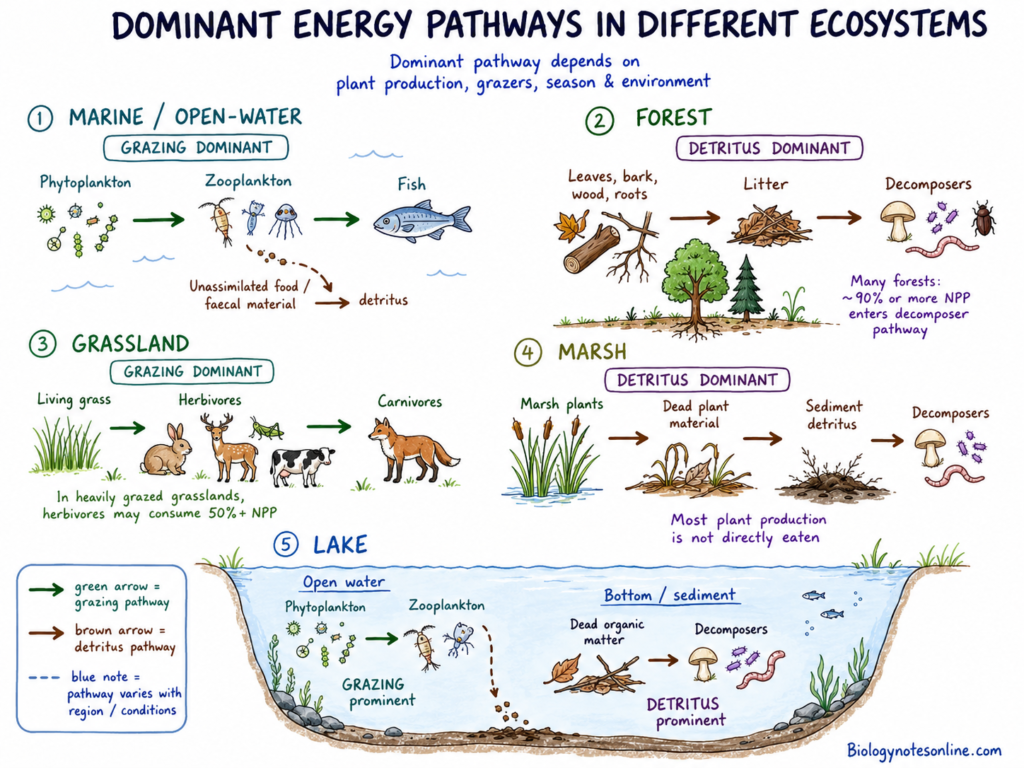
The grazing and detritus pathways are not equally important in every ecosystem. In some ecosystems, the grazing pathway is more active. In others, most of the energy enters into the detritus pathway.
The dominant pathway may also change within different regions of the same ecosystem. It depends on plant production, number of grazers, season and different environmental conditions.
Marine and Open-Water Ecosystems
In marine and open-water ecosystems, phytoplanktons are the main primary producers. They are directly consumed by herbivorous zooplanktons.
Thus, the grazing pathway is generally more prominent in the open-water region.
The zooplanktons do not digest all the consumed phytoplanktons. A part of the unassimilated food is released as faecal material. This material enters into the detritus pathway.
Forest Ecosystems
Forest ecosystems produce a large amount of leaves, bark, wood and roots. These plant materials contain lignin and cellulose. Due to this, they are not easily consumed by herbivores.
A large part of plant materials falls on the forest floor as litter. Thus, the detritus pathway is dominant in forest ecosystems.
The dead organic materials are decomposed by soil bacteria, fungi and different invertebrates. In many forests, about 90% or more of the net primary production may enter into the decomposer pathway.
Grasslands, Marshes and Lake Zones
In heavily grazed grasslands, a large amount of living plant materials is directly consumed by herbivores. Therefore, the grazing pathway becomes more important. In some grasslands, herbivores may consume 50% or more of the net primary production.
In marsh ecosystems, most of the plant production is not directly consumed. The dead plant materials enter into the sediment after senescence. Thus, the detritus pathway is more dominant.
Different pathways may also occur in different regions of a lake. In the open-water region, phytoplanktons are consumed by zooplanktons and the grazing pathway is prominent. In the lake bottom and sediment, dead organic materials are accumulated and the detritus pathway becomes more important.
Why Is the Y-Shaped Model More Realistic?
The following are the reasons why the Y-shaped energy flow model is more realistic-
- It includes two energy pathways – The model includes the grazing food chain and the detritus food chain together. Both pathways operate in the same ecosystem.
- It shows the importance of detritus – A large part of plant production is not consumed by herbivores. In forests and marshes, about 80% to 90% or more production may enter into the detritus pathway.
- It represents ecosystem stratification – Different energy pathways may occur in different layers and regions of an ecosystem. The grazing pathway may occur in one region, while detritus pathway may become important in another region.
- It separates immediate and delayed energy flow – Living plant materials are directly consumed in the grazing pathway. Dead organic materials are used after their death and accumulation in the detritus pathway.
- It includes different consumer groups – The grazing pathway mainly includes macroconsumers such as herbivores and carnivores. The detritus pathway includes microconsumers such as bacteria and fungi, together with detritivores.
- It shows connection between both pathways – Faeces, undigested food and dead organisms from the grazing food chain enter into the detritus pathway. Thus, both pathways are connected with each other.
- It gives a natural pattern of energy flow – Energy does not pass through only one linear food chain in natural ecosystems. It is divided into different pathways and is lost as heat during each trophic transfer.
Comparison with Other Energy-Flow Models
Y-Shaped Model Versus Single-Channel Model
| Comparison Feature | Single-Channel Energy-Flow Model | Y-Shaped (Double-Channel) Model |
|---|---|---|
| Number of Pathways | Models energy moving through a single pathway. | Models energy moving simultaneously through two distinct pathways (grazing and detritus channels). |
| Pathway Structure | Linear chain (Sun → Producers → Herbivores → Carnivores) without cross-channel links. | Interconnected channels where waste, feces, and dead organisms cross over between pathways. |
| Treatment of Dead Organic Matter | Treats unconsumed organic matter as unutilized loss or an inactive sediment sink. | Explicitly incorporates dead organic matter as the primary energy source driving the detrital arm. |
| Treatment of Decomposers | Omits decomposers or places them at the end of the chain as a terminal endpoint. | Places decomposers in a dedicated compartment, separating microconsumers (bacteria/fungi) from macroconsumers. |
| Simplicity vs. Ecological Realism | High structural simplicity, but low ecological realism because it ignores detrital energy dominance. | Higher structural complexity, providing high ecological realism by accounting for all energy pathways. |
| Appropriate Uses | Ideal for introductory instruction, simple energy balance illustrations, and strictly grazing-dominated chains. | Ideal for ecosystem-level analysis of complex real-world habitats (forests, salt marshes, estuaries, lakes). |
Y-Shaped Model Versus Universal Energy-Flow Model
| Comparison Feature | Y-Shaped (Double-Channel) Model | Universal Energy-Flow Model |
|---|---|---|
| Attribution & Dates | Pioneered by H.T. Odum in 1956 and expanded by E.P. Odum in 1983. | Formulated by E.P. Odum in 1968 as a standardized bioenergetic framework. |
| Core Structural Focus | Represents ecosystem-level food web architecture, specifically splitting primary production into grazing and detrital pathways. | Represents internal bioenergetic partitioning—mapping Ingestion (I), Assimilation (A), Respiration (R), Production (P), Storage (S), and Excretion (E). |
| Level of Application | Tailored specifically to whole ecosystem and community-level energy flow dynamics. | Highly flexible; can be applied to an individual organism, single population, trophic group, or entire ecosystem. |
| Conceptual Distinction | Maps who eats whom across parallel community channels (grazing vs. detrital branches). | Maps how any single biological unit processes, uses, and dissipates energy passing through its boundary. |
Note on Model Distinction– While both models were developed by the Odum brothers to advance ecosystem ecology, they are not exact synonyms. The Y-shaped model maps the macro-architectural split between live grazing and dead detrital food chains at the ecosystem level, whereas the Universal model provides a bioenergetic block diagram showing internal energy allocation (I,A,R,P,S) for any living component or scale.
Advantages of Y-Shaped Model
The following are the advantages of the Y-shaped energy flow model–
- More realistic model – It gives a more practical representation of energy flow in natural ecosystems. It is more useful than the simple linear energy flow model.
- Includes two food chains – It includes the grazing food chain and the detritus food chain in the same model. Both pathways operate together in an ecosystem.
- Shows ecosystem stratification – The model represents the energy flow through different layers and regions of an ecosystem. It follows the natural stratified structure of ecosystems.
- Shows difference in time and space – The living plant materials are immediately consumed in the grazing pathway. The dead organic materials are decomposed after their accumulation in the detritus pathway.
- Includes different types of consumers – It includes macroconsumers such as herbivores and carnivores. It also includes microconsumers such as bacteria and fungi.
- Shows connection between two pathways – Dead organisms, faecal materials and undigested food from the grazing pathway enter into the detritus pathway. Detritivores may also be consumed by predators.
- Shows the importance of detritus – In forests, salt marshes and estuaries, a large amount of primary production enters into the detritus pathway. About 80% to 90% or more plant production may be used by decomposers.
Limitations of Y-Shaped Model
The following are the limitations of the Y-shaped energy flow model–
- Does not show individual energy budget – The model shows energy flow at the ecosystem level. It does not show ingestion, assimilation, respiration, storage and excretion of an individual organism.
- Simplifies complex food webs – Natural ecosystems contain many interconnected food chains. The model mainly divides energy flow into only the grazing and detritus pathways.
- Difficult to measure energy flow – Energy flow through bacteria, fungi, animals and detritivores is difficult to calculate. These organisms have different size and metabolic activities.
- Gives a static representation – The amount of energy entering into both pathways changes with season, location and environmental conditions. A single diagram cannot show all these changes.
- Does not show detailed nutrient cycling – The model mainly shows unidirectional energy flow. It does not properly represent the recycling of carbon, nitrogen, phosphorus and other nutrients.
- Does not include all feeding relationships – Omnivory, parasitism and several alternative feeding pathways are not shown clearly. Thus, the complete food web structure is not represented.
- Needs large amount of ecological data – Accurate study of both pathways requires information about biomass, productivity, respiration and decomposition. Such data are not always easily available.
Ecological Importance of Y-Shaped Model
The following are the ecological importance of the Y-shaped energy flow model–
- Shows two energy pathways – It includes the grazing food chain and the detritus food chain in the same ecosystem. Thus, it gives the actual pattern of energy movement.
- Represents ecosystem stratification – The model shows energy flow through different layers and regions. Different pathways may become active in different parts of the ecosystem.
- Shows variation in time and space – Living plant materials are consumed immediately in the grazing pathway. Dead organic materials are decomposed after some time in the detritus pathway.
- Includes macroconsumers and microconsumers – Herbivores and carnivores act as macroconsumers. Bacteria and fungi act as microconsumers. Their size and metabolic activities are different.
- Shows interconnection of food chains – Faeces, undigested materials and dead organisms enter into the detritus pool. Detritivores may also be consumed by higher predators.
- Explains the importance of detritus – In forests, salt marshes and estuaries, most of the plant production enters into the detritus pathway. About 80% to 90% or more production may be used by decomposers.
- Supports ecosystem stability – Dead organic materials remain stored for some period. It provides food to different decomposers and detritivores during unfavourable conditions.
- Supports biodiversity – The two pathways provide food and energy to different groups of organisms. It supports producers, consumers, decomposers and detritivores.
- Helps in ecosystem study – The model is used to study ecosystem productivity and energy distribution. It also helps to understand the effect of environmental changes and human activities.
Examples of the Y-Shaped Energy Pathway
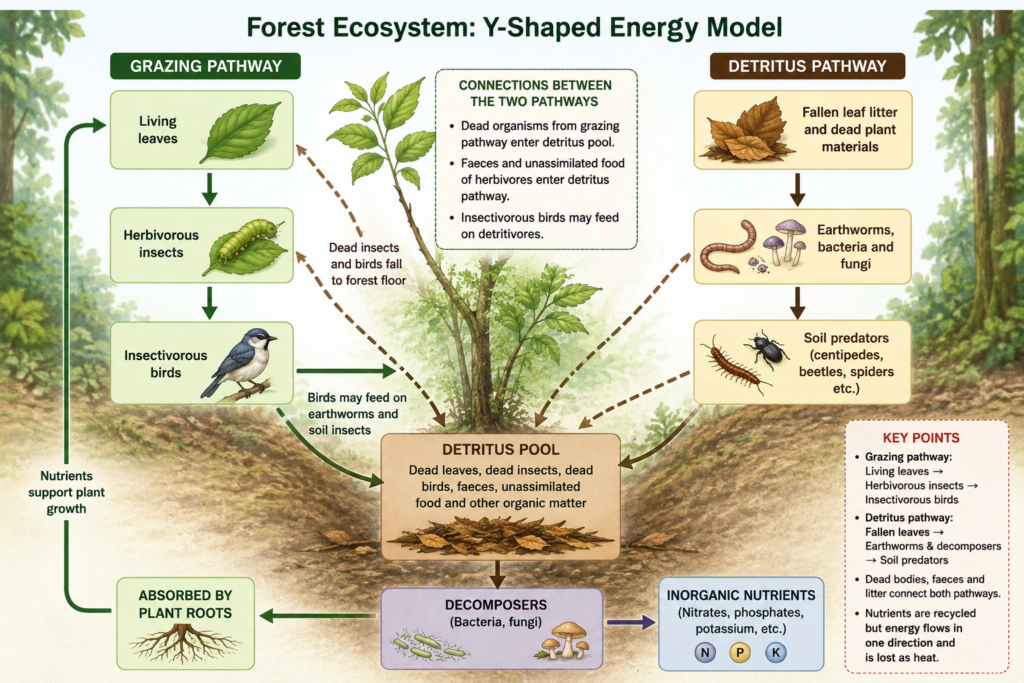
1. Forest Example
In forest ecosystem, living leaves are the main starting material of grazing pathway. The leaves are eaten by herbivorous insects. These insects are further consumed by insectivorous birds. The reaction is as follows-
Living leaves → Herbivorous insects → Insectivorous birds
The detritus pathway starts from fallen leaves and other dead plant materials. Earthworms, bacteria and fungi use these materials as food. Soil predators then consume the earthworms and other small detritivores. The pathway is as follows-
Fallen leaf litter → Earthworms and decomposers → Soil predators
Dead insects and birds also fall on the forest floor. These dead materials become a part of detritus pool. Insectivorous birds may also feed on earthworms and soil insects. Thus, the two pathways are connected with each other. During decomposition, inorganic nutrients are released in soil. These nutrients are again absorbed by the plant roots.
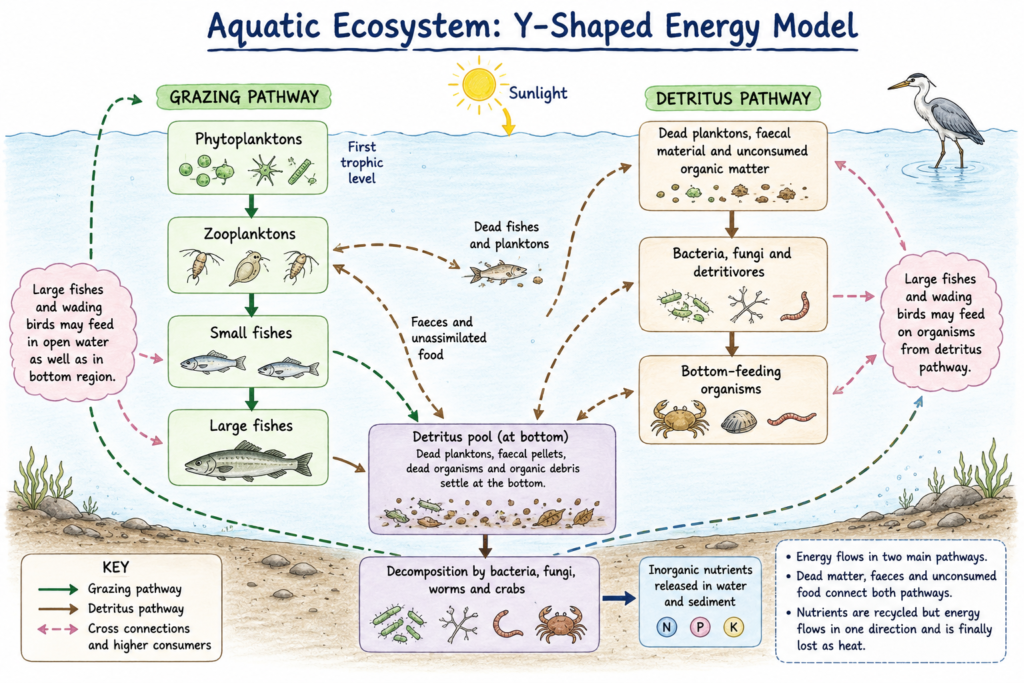
2. Aquatic Example
In aquatic ecosystem, phytoplanktons form the first trophic level. These are consumed by zooplanktons. Small fishes feed on zooplanktons and large fishes consume the small fishes. The pathway is as follows-
Phytoplanktons → Zooplanktons → Small fishes → Large fishes
The detritus pathway starts from dead planktons, faecal matters and unconsumed organic materials. These materials are acted upon by bacteria and other detritivores. Bottom-feeding organisms consume these detritivores. The pathway is as follows-
Dead planktons and faecal materials → Bacteria and detritivores → Bottom-feeding organisms
Dead planktons and faecal pellets settle at the bottom of lake or sea. Bacteria, fungi, worms and crabs decompose these materials. Large fishes and wading birds may consume organisms of open water as well as bottom region. In this way, energy from both pathways enters into the higher trophic levels.
Single-Channel, Y-Shaped and Universal Energy-Flow Models
| Model | Main Focus | Pathways Shown | Treatment of Decomposers | Level of Application | Major Advantage | Main Limitation | Associated Scientist / Date |
|---|---|---|---|---|---|---|---|
| Single-Channel Model | Linear, unidirectional transfer of solar energy through successive consumer trophic levels. | A single linear grazing pathway (Sun → Producers → Herbivores → Carnivores). | Omitted or placed at the terminal end as an unutilized energy loss / sediment sink. | Linear food chains / simple trophic levels. | Simple and straightforward; clearly illustrates progressive energy attenuation and the 10% law. | Low ecological realism; ignores the detritus pathway, which processes 80–90% of NPP in many systems. | Raymond Lindeman (1942) / H.T. Odum (1956) |
| Y-Shaped (Double-Channel) Model | Ecosystem-level macro-architecture showing the simultaneous operation and crossover of grazing and detrital streams. | Dual branching pathways (Grazing chain + Detritus chain) with cross-channel transfers (feces, carcasses, cross-predation). | Placed in a dedicated compartment, sharply separating microconsumers (bacteria/fungi) from macroconsumers in space and time. | Whole ecosystem / community level. | High ecological realism; accounts for detritus dominance, spatial stratification, time lags, and size-metabolism differences. | Does not detail internal physiological energy allocation (I,A,R,P,S) for individual species, and simplifies complex food webs into two main arms. | H.T. Odum (1956) & E.P. Odum (1983) |
| Universal Energy-Flow Model | Internal bioenergetic partitioning and metabolic energy budgeting (I,A,R,P,S,E) within living biomass. | Generalized input and output energy channels passing across a single living structure or biomass boundary. | Can represent any biological box/tier, treating decomposer populations or microconsumers under standard bioenergetic rules. | Highly flexible; applicable to an individual organism, population, trophic group, or whole ecosystem. | Universal applicability across biological scales; quantifies internal energy allocation and metabolic maintenance costs. | Complex to measure empirically across whole communities; does not explicitly layout macro community architecture (grazing vs. detritus) in a single-box view. | E.P. Odum (1968) |
Frequently Asked Questions
What is the Y-shaped energy flow model?
The Y-shaped energy flow model, also called the double-channel model, is an ecological framework that illustrates how energy moves through an ecosystem along two parallel pathways. Instead of modeling energy as a single linear chain, it shows net primary production from autotrophs splitting into a grazing food chain and a detritus food chain, capturing how energy flows simultaneously through living consumers and decomposers.
Who proposed the Y-shaped energy flow model?
The model was originally proposed and pioneered by H.T. (Howard T.) Odum in 1956 to overcome the oversimplifications of earlier linear energy flow models. It was later expanded, refined, and generalized by his brother, E.P. (Eugene P.) Odum, in 1983 to create a broader framework applicable across diverse terrestrial and aquatic ecosystems.
Why is the model called Y-shaped?
The model is named for its visual architecture, which resembles the letter “Y”. Primary producers (such as green plants or algae) form the single base or stem where solar energy enters the ecosystem. The energy flow then bifurcates or splits into two distinct diverging branches or arms: one leading to grazers and the other leading to detritivores and decomposers.
What are the two arms of the model?
The two arms are the grazing food chain and the detritus food chain. The grazing arm represents the direct, real-time consumption of living plant biomass by herbivores, which are subsequently eaten by carnivores. The detritus arm represents the delayed breakdown of dead organic matter, fallen litter, animal remains, and fecal waste by saprotrophic bacteria, fungi, and detritivores.
How are the grazing and detritus food chains connected?
The two pathways continuously exchange energy and material under natural conditions. Fecal waste and unassimilated food egested by herbivores in the grazing chain enter the detritus pathway directly. Additionally, when organisms in the grazing chain die, their unconsumed bodies pass into the detritus pool, while higher-level predators frequently prey on detritivores, linking the two channels into an integrated network.
Which energy pathway dominates in a forest ecosystem?
The detritus food chain dominates in forest ecosystems. Because forest biomass consists largely of woody stems, bark, and high-lignin leaves, less than 10% of net primary production is typically consumed by living herbivores. Consequently, 90% or more of the net primary production falls to the ground as litter, where it fuels the soil decomposer network.
Which pathway dominates in an aquatic ecosystem?
In open-water aquatic environments—such as pelagic marine waters or lake open-water zones—the grazing pathway often dominates, as phytoplankton are rapidly consumed by zooplankton. However, aquatic systems are not uniform; shallow coastal zones, salt marshes, and lake sediment beds operate primarily as detritus-dominated systems where decaying organic matter accumulates on the seafloor.
Why is the Y-shaped model more realistic than the linear model?
The Y-shaped model is more realistic because it incorporates the detritus food chain, which processes the vast majority of organic matter in many ecosystems. Unlike single-channel linear models that ignore decomposers, the Y-shaped model aligns with ecosystem stratification, accounts for time lags in organic breakdown, and distinguishes between the vastly different size-metabolism relations of macroconsumer animals and microconsumer microbes.
Is the Y-shaped model the same as the universal model?
No, they are distinct models. The Y-shaped model maps whole-ecosystem food web architecture by splitting primary production into grazing and detrital channels. In contrast, E.P. Odum’s Universal Energy Flow Model (1968) is a bioenergetic framework that tracks internal energy partitioning—such as ingestion, assimilation, respiration, production, and storage—for any single organism, population, trophic group, or ecosystem.
What are the limitations of the double-channel model?
While more realistic than linear models, the Y-shaped model simplifies multi-layered, complex food webs into just two primary channels. It does not quantify internal physiological bioenergetic allocation (such as ingestion, respiration, and storage) for individual species. Additionally, it tracks the unidirectional flow and dissipation of energy rather than cyclic nutrient recycling, and static diagrams cannot dynamically reflect seasonal energy shifts.
References
- D’Croz, L., Del Rosario, J. B., & Gómez, J. A. (1989). Degradation of red mangrove (Rhizophora mangle L.) leaves in the Bay of Panamá. Revista de Biología Tropical, 37(1), 139–144. Organization for Tropical Studies.
- Eco-intelligent. (2016, November 17). Y-shaped energy flow model: Who eats whom in nature. Eco-intelligent. https://eco-intelligent.com/2016/11/17/y-shaped-model-of-energy-flow-who-eats-whom-in-nature/
- Environmental Studies Institute. (n.d.). Understanding energy flow in ecosystems: Key models explained. EVS Institute. https://evs.institute/fundamentals-of-environmental-science-and-ecology/energy-flow-ecosystems-key-models/
- Felts, N. (2020, June 23). Odum’s 1960s Everglades studies shape the science of ecology. National Park Service. https://www.nps.gov/articles/nutrient-flow-ever.htm
- Fleming, M., Lin, G., & Sternberg, L. D. L. (1990). Influence of mangrove detritus in an estuarine ecosystem. Bulletin of Marine Science, 47(3), 663–669.
- Gaunker, D. D. (n.d.). Models of energy flow (Unit VIII: Plant Ecology and Phytogeography, Course BOC-110) [Course transcript and materials]. Goa University / DISHTAVO.
- Gugan, D. (2023). Ecosystem [Unpublished Bachelor of Computer Applications project report]. Department of Mathematics, K.C.S. Kasi Nadar College of Arts & Science, Chennai.
- Hooghly Women’s College. (n.d.). Energy flow through the ecosystem [Academic notes]. Department of Zoology, Hooghly Women’s College.
- Kristensen, E., Bouillon, S., Dittmar, T., & Marchand, C. (2008). Organic carbon dynamics in mangrove ecosystems: A review. Aquatic Botany, 89(2), 201–219. https://doi.org/10.1016/j.aquabot.2007.12.005
- McGoff, N. M. (2004). Marsh grasshopper influence on salt marsh nutrient cycling and productivity [Master’s thesis, University of Virginia]. Virginia Coast Reserve Long-Term Ecological Research (VCR-LTER).
- Odum, E. P., & Smalley, A. E. (1959). Comparison of population energy flow of a herbivorous and a deposit-feeding invertebrate in a salt marsh ecosystem. Proceedings of the National Academy of Sciences of the United States of America, 45(4), 617–622. https://doi.org/10.1073/pnas.45.4.617
- Pomeroy, L. R., Johannes, R. E., Odum, E. P., & Roffman, B. (1969). The phosphorus and zinc cycles and productivity of a salt marsh. In D. J. Nelson & F. C. Evans (Eds.), Symposium on Radioecology: Proceedings of the Second National Symposium (pp. 412–419). U.S. Atomic Energy Commission.
- Rupahi College. (n.d.). Ecosystem ecology [Class notes]. Department of Zoology, Rupahi College.
- Silliman, B. R., & Zieman, J. C. (2001). Top-down control of Spartina alterniflora production by periwinkle grazing in a Virginia salt marsh. Ecology, 82(10), 2830–2845. https://doi.org/10.1890/0012-9658(2001)082[2830:TDCOSA]2.0.CO;2
- Singh, A. K. (n.d.). Food chains and food webs [Lecture notes]. Dr. Shyama Prasad Mukherjee University.
- Small, G. (n.d.). Georgia salt marsh energy flow study [Computational network analysis]. EcoNet, Department of Engineering, University of Georgia. https://eco.engr.uga.edu/DOC/econet5.html
- Sobczak, W. V. (2005). Lindeman’s trophic-dynamic aspect of ecology: “Will you still need me when I’m 64?”. Limnology and Oceanography Bulletin, 14(3), 53–57. https://doi.org/10.1002/lob.200514353
- Teal, J. M. (1962). Energy flow in the salt marsh ecosystem of Georgia. Ecology, 43(4), 614–624. https://doi.org/10.2307/1933451
- Teal, J. M. (1986). The ecology of regularly flooded salt marshes of New England: A community profile (Biological Report 85(7.4)). U.S. Fish and Wildlife Service, Division of Biological Services.