

What is Energy Flow in an Ecosystem?
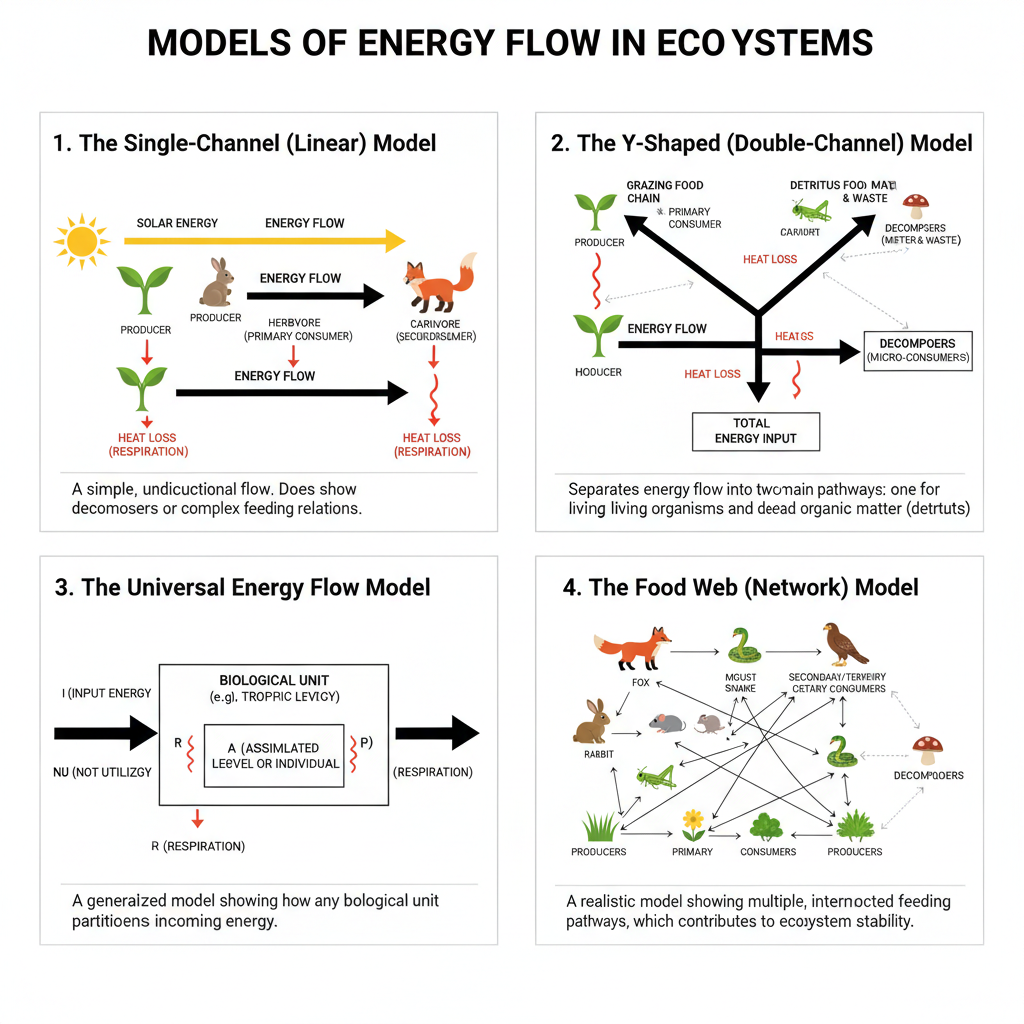
Energy flow models are used to show how energy passes through different trophic levels of an ecosystem. It shows the input of energy, transfer of energy and loss of energy in each level. Energy always move in one direction. It is not recycled like nutrients.
The single channel energy flow model is also known as linear energy flow model. It was given by H.T. Odum in 1956. In this model energy flows from producers to herbivores and then to carnivores. During this process, energy is lost as heat in metabolic activities. So energy decreases gradually in each successive trophic level.
The Y-shaped energy flow model is also called double channel model. It shows two pathways of energy flow, one is grazing food chain and another is detritus food chain. In grazing pathway, living plants are directly eaten by herbivores. In detritus pathway, dead organic matter and waste materials are decomposed by microorganisms. Both pathways are connected with each other in nature.
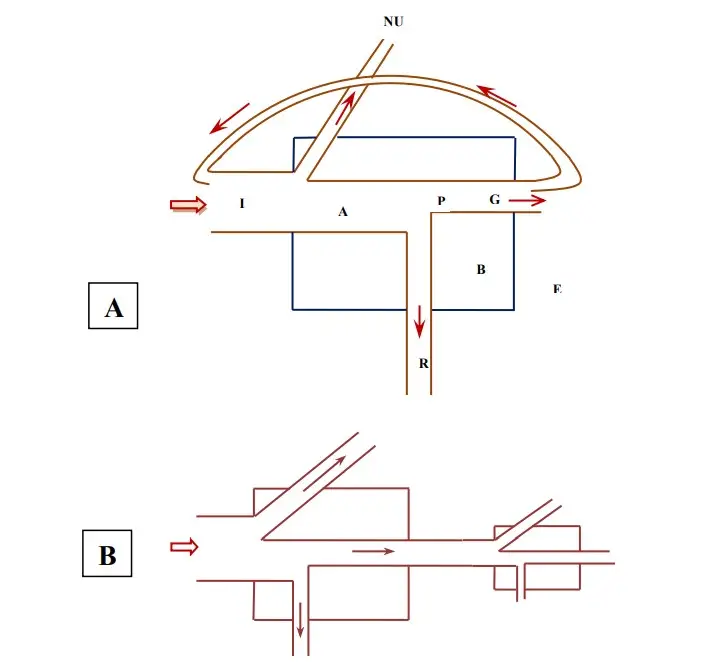
The universal energy flow model was given by E.P. Odum in 1968. This model can be applied to any living component such as an individual, population or whole ecosystem. In this model, total energy input is divided into assimilated energy and non-utilized energy. The assimilated energy is again used in respiration, growth, reproduction and storage as net production.
Characteristics of Energy Flow
The following are the main characteristics of energy flow in ecosystem-
- The major source of energy in ecosystem is sunlight. It is trapped by green plants and converted into chemical energy during photosynthesis.
- Energy flow is unidirectional. It moves from sun to producers, then to consumers and finally passes into the environment as heat.
- Energy passes through different trophic levels. It moves from producers to herbivores and then to carnivores through food chain and food web.
- Energy is not recycled in ecosystem like nutrients. Once energy is lost as heat, it cannot return back to the previous trophic level.
- The amount of available energy decreases in each successive trophic level. Much energy is lost during respiration, movement, digestion and other metabolic activities.
- Only a small amount of energy present in one trophic level is transferred to the next trophic level. Generally about 10% energy is transferred and remaining amount is lost or unused.
- Energy flow follows the first law of thermodynamics and second law of thermodynamics. Energy is changed from one form to another and some usable energy is always lost as heat.
- Continuous supply of energy is needed for the working of ecosystem. Because energy is not recycled, regular input of solar energy is necessary.
- Decomposers also take part in energy flow. Bacteria and fungi obtain energy from dead plants, dead animals and waste materials.
- The gradual loss of energy limits the length of food chain. So food chains generally contain only few trophic levels and top carnivores are less in number.
Significance of Energy Flow in an Ecosystem
- Energy flow helps to sustain all life in an ecosystem. The main source of energy is sunlight. It is trapped by producers and then passed to consumers. Without continuous input of energy, the ecosystem cannot remain active.
- Energy flow forms the feeding relationship between organisms. It arranges organisms into different trophic levels like producers, herbivores, carnivores and decomposers. In this way food chain and food web are formed.
- Energy flow limits the length of food chain. When energy moves from one trophic level to another, much energy is lost as heat during respiration and other metabolic process. So only small amount of energy reaches the next level.
- The number of top carnivores is controlled by energy flow. At higher trophic level, energy becomes very less. So animals like tiger, eagle and other predators are fewer in number than plants and herbivores.
- Energy flow is also related with nutrient recycling. The dead plants, dead animals and waste materials contain chemical energy. This energy is used by bacteria and fungi for decomposition. During this process inorganic nutrients are returned to soil and water.
- Energy flow helps to know the productivity of an ecosystem. By studying ecological pyramid, the amount of energy present in each trophic level can be understood. It also indicates the stability and health of ecosystem.
- Energy flow is useful in management of natural resources. It helps in proper conservation, fishing limit, habitat protection and food production. Food obtained from lower trophic level is more energy efficient than food obtained from higher trophic level.
10% Law of Energy Transfer in Ecosystem
The 10% law of energy transfer states that only about 10% of the total energy present in one trophic level is transferred to the next trophic level. The remaining amount of energy is lost during different metabolic activities. This law was proposed by Raymond Lindeman in 1942.
When energy passes from producers to herbivores and then to carnivores, a large amount of energy is used in respiration, movement, digestion, growth and reproduction. Some energy is also lost through undigested food and waste materials. Finally, much of the energy is released into the environment as heat.
For example, if producers contain 10,000 kJ of energy, only about 1,000 kJ energy is transferred to herbivores. From herbivores, about 100 kJ is transferred to primary carnivores. Only about 10 kJ energy may reach the secondary carnivores.
The energy transfer is as follows-
Producers (10,000 kJ) → Herbivores (1,000 kJ) → Primary carnivores (100 kJ) → Secondary carnivores (10 kJ)
The efficiency of energy transfer between two trophic levels is referred to as ecological efficiency. It can be calculated by the following formula-
Ecological efficiency = Energy available at next trophic level / Energy available at previous trophic level × 100
The 10% law explains why the amount of energy decreases at each successive trophic level. It also explains why food chains are generally short and why the number of top carnivores is less in an ecosystem. The actual amount of energy transferred may vary in different ecosystems, but generally only a small part of energy reaches the next trophic level.
Laws of Thermodynamics in Energy Flow
Energy flow in ecosystem follows the first law of thermodynamics and second law of thermodynamics. These laws explain the transformation and loss of energy during its movement through different trophic levels.
First Law of Thermodynamics
The first law of thermodynamics states that energy can neither be created nor destroyed. It can only be changed from one form to another form.
In ecosystem, solar energy is trapped by green plants. During photosynthesis, light energy is converted into chemical energy and stored in food. This energy then passes from producers to herbivores and then to carnivores.
The total energy input and output remain balanced. Energy enters into ecosystem mainly as sunlight and finally leaves as heat. So energy is not destroyed during this process.
Second Law of Thermodynamics
The second law of thermodynamics states that during every energy transformation, some amount of energy is lost as heat. This heat cannot be used again by organisms.
When energy moves from one trophic level to another, much energy is used in respiration, movement, digestion and other metabolic activities. During this process much amount is released as heat.
So the amount of available energy decreases in each successive trophic level. Higher trophic levels get less energy than lower trophic levels. Due to this loss, continuous supply of solar energy is needed for the working of ecosystem.
Trophic Levels and Direction of Energy Flow
The organisms present in an ecosystem are arranged into different feeding levels called trophic levels. Each trophic level shows the position of an organism in a food chain according to its source of energy.
The first trophic level is formed by producers such as green plants and algae. They trap solar energy and convert it into chemical energy by photosynthesis.
The second trophic level is formed by herbivores or primary consumers. They obtain energy by feeding directly on producers.
The third trophic level includes primary carnivores or secondary consumers. They obtain energy by feeding on herbivores. The next trophic levels are formed by secondary and tertiary carnivores.
Decomposers such as bacteria and fungi obtain energy from dead plants, dead animals and waste materials. They act on the organic matter present in all trophic levels.
The direction of energy flow is always one way. It moves from sun to producers, then to herbivores and carnivores. Finally, much amount of energy is released into the environment as heat.
The direction of energy flow is as follows-
Sun → Producers → Herbivores → Primary carnivores → Secondary carnivores
Energy cannot move back to the previous trophic level. It is also not recycled like nutrients. So continuous input of solar energy is needed for the working of ecosystem.
The amount of available energy decreases at each successive trophic level. Due to this, producers contain the highest amount of energy and top carnivores contain the lowest amount of energy.
Different Models of Energy Flow in Ecosystem
- Single Channel Energy Flow Model – Single channel energy flow model is also known as linear energy flow model. It was given by H.T. Odum in 1956. In this model, energy flows in one direction from producers to herbivores and then to carnivores. Energy is not recycled and it decreases at each trophic level due to loss of heat during respiration and metabolic activities.
- Y-shaped Energy Flow Model – Y-shaped energy flow model is also called double channel energy flow model. It shows two channels of energy flow, one is grazing food chain and another is detritus food chain. In grazing food chain, energy passes from living plants to herbivores and carnivores. In detritus food chain, energy passes through dead organic matter, waste materials and decomposers. Both channels are connected in nature.
- Universal Energy Flow Model – Universal energy flow model was introduced by E.P. Odum in 1968. This model can be applied to any living component of ecosystem such as individual, population, trophic group or whole ecosystem. In this model, total energy input is divided into assimilated energy and non-utilized energy. The assimilated energy is used in respiration and stored as net production for growth and reproduction.
Linear Energy Flow Model (Single Channel Energy Flow Model)
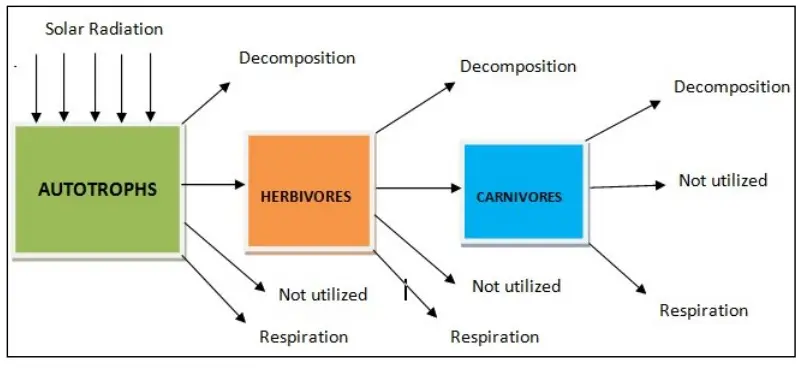
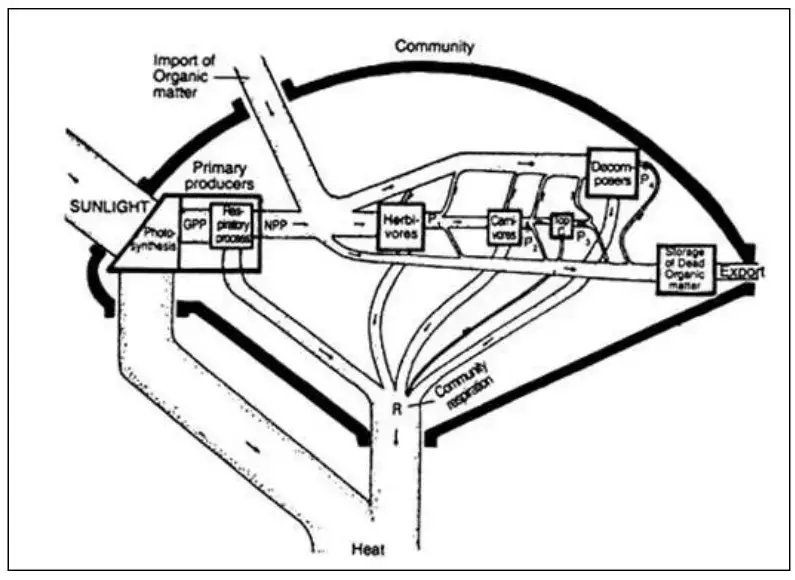
Linear energy flow model is also called single channel energy flow model. It was given by H.T. Odum in 1956. This model shows the one way flow of energy in an ecosystem.
In this model, solar energy is first trapped by autotrophs or green plants. Then this energy passes from producers to herbivores and then to carnivores. The movement of energy is unidirectional. It does not come back to the source again.
The important feature of this model is gradual decrease of energy at each trophic level. During transfer of energy, much amount is lost as heat in respiration and metabolic process. So the higher trophic levels get less energy than the lower trophic levels.
This model is based on the law of thermodynamics. Energy cannot be recycled in the ecosystem like nutrients. So continuous supply of energy is needed from outside, mainly from sunlight.
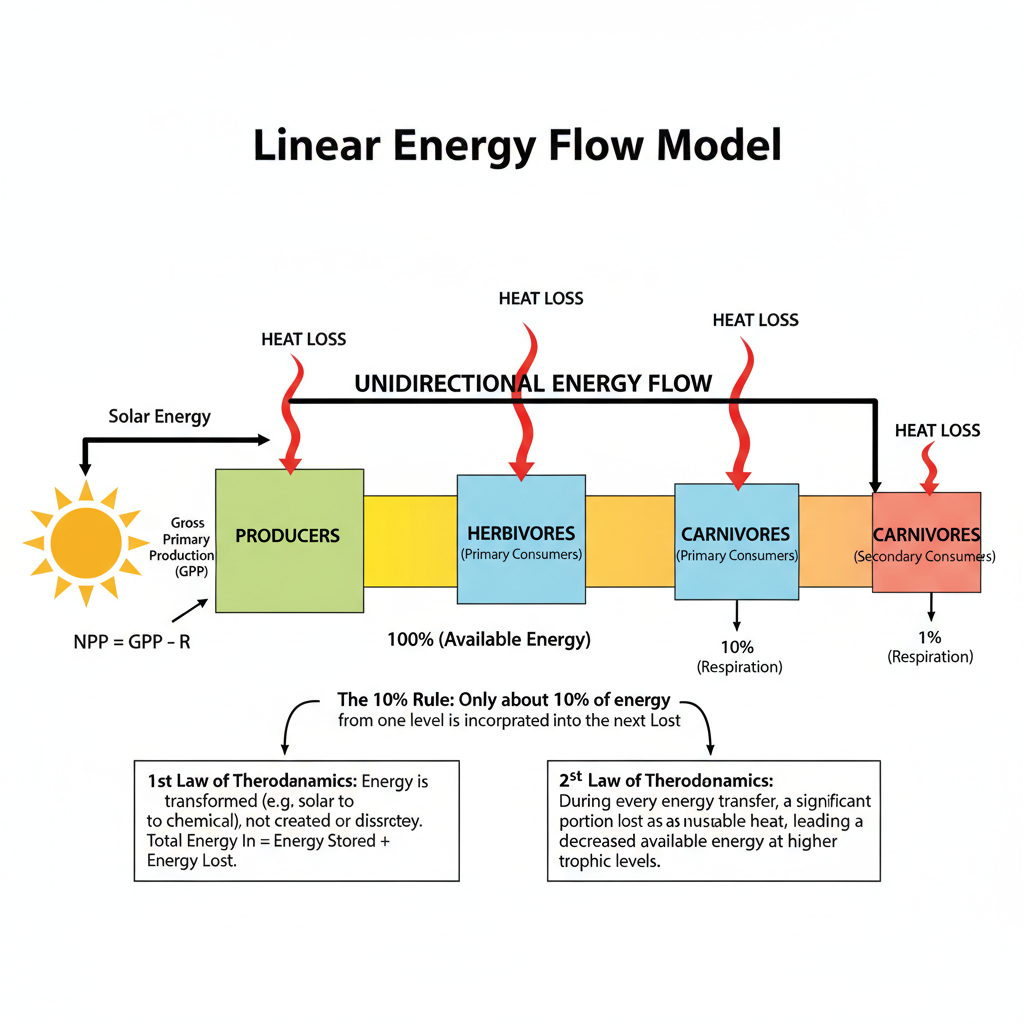
How the Linear Energy Flow Model (Single Channel Energy Flow Model) Works?
- Energy input – The process starts with the entry of solar energy into the ecosystem. This energy is captured by autotrophs or green plants. They act as primary producers.
- Primary production – Green plants absorb light energy and convert it into food energy by photosynthesis. The total energy fixed by plants is called gross primary production. Some energy is used in respiration and remaining part is stored as net primary production.
- First energy transfer – Energy then passes from producers to primary consumers. Primary consumers are mainly herbivores. They get energy by eating the green plants.
- Next energy transfer – The herbivores are eaten by secondary consumers or carnivores. Then energy passes to the next higher trophic level. In this way energy moves upward in the food chain.
- Progressive energy loss – At each trophic level, much energy is lost as heat. This loss occur due to respiration, digestion, movement and other metabolic activities. Generally about 90% energy is lost and only small amount goes to next level. This low ecological efficiency means only a small amount of energy reaches the next trophic level.
- Decrease of biomass – With the decrease of energy, the biomass or standing crop also decreases in each successive trophic level. In diagram, the boxes become smaller and the pipes become narrow. It shows less stored energy and less energy flow.
- Balancing of energy – In the whole system, total energy input and output remain balanced. It follows the first law of thermodynamics. Energy enters as light and leaves mainly as heat.
- Dependence on sunlight – This model is non-cyclic. Energy is not recycled back to the source. So continuous supply of solar energy is needed for the working of ecosystem.
Uses of Linear Energy Flow Model (Single Channel Energy Flow Model)
- Linear energy flow model is used to show the unidirectional flow of energy in ecosystem. It shows that energy moves from sunlight to producers and then to consumers.
- It is used to explain that energy is not recycled in ecosystem. The energy passes in one way path only and it does not return back to its original source.
- It is used to show the role of producers, herbivores and carnivores in energy transfer. In this model, each organism is arranged in a definite trophic level.
- It is used to explain the laws of thermodynamics in ecosystem. The total energy input and output remain balanced, but some energy is always lost as heat during transfer.
- It is used to show the loss of energy at each trophic level. During respiration and metabolic activities, much energy is lost as heat. So less energy is available for next level.
- It is used to explain the decrease of biomass or standing crop in higher trophic levels. The amount of stored energy becomes less from producers to carnivores.
- It is used to study the boundary and energy movement of a community. It shows the input, output, storage, import and export of organic matter in ecosystem.
- It is used to show the dependence of ecosystem on continuous solar energy. If the external energy source is stopped, the energy flow cannot continue properly.
Advantages
- Linear energy flow model gives a simple and clear idea about energy flow in ecosystem. It shows a single pathway from producers to herbivores and then to carnivores.
- It helps to understand the basic feeding relationship of organisms. It shows who eats whom and how energy passes from one trophic level to another trophic level.
- It clearly shows the unidirectional flow of energy. Energy moves in one way only. It is not returned back to the source and not recycled like nutrients.
- It explains the law of thermodynamics in ecosystem. The first law is shown by balance of energy input and output. The second law is shown by loss of energy as heat during each transfer.
- It shows the gradual decrease of available energy at higher trophic levels. In each step, much energy is lost in respiration and metabolic activities.
- It helps to show the decrease of biomass or standing crop in each successive trophic level. In diagram, smaller boxes and narrow pipes are used to show less stored energy and less energy transfer.
- It is useful for defining the boundary of a community. It helps to study the input, output, import, export and storage of organic matter in the ecosystem.
- It shows the dependence of ecosystem on continuous solar energy. Because energy flow is non-cyclic, regular energy input from outside is needed.
Limitations
- Linear energy flow model is too simple in nature. It shows only one straight pathway of energy flow. But in real ecosystem, organisms feed on many types of food and form a complex food web.
- It does not show the detritus food chain properly. This model mainly explains the grazing food chain. But in many terrestrial ecosystems, large amount of energy flows through dead organic matter.
- It does not separate the different types of consumers. The macro-consumers like animals and micro-consumers like bacteria and fungi are not shown separately. Their size, activity and metabolic rate are different.
- It gives only general idea of decrease of energy and biomass. It does not show the exact relation between energy production and biomass. Sometimes small biomass like algae may produce more energy than large biomass of leaves.
- It shows the ecosystem as very fragile. In this model, if one link is removed then the whole chain appears to be disturbed. But in real ecosystem, alternative food pathways are present.
- It does not explain the connection between living organisms and decomposers clearly. Dead bodies, wastes and unused materials also carry energy, but this pathway is not properly included.
- It is less suitable for complex ecosystem. Natural ecosystem have many producers, many consumers and many decomposers. So single channel model cannot show all these interactions clearly.
Y-Shaped Energy Flow Model (Double Channel Energy Flow Model)
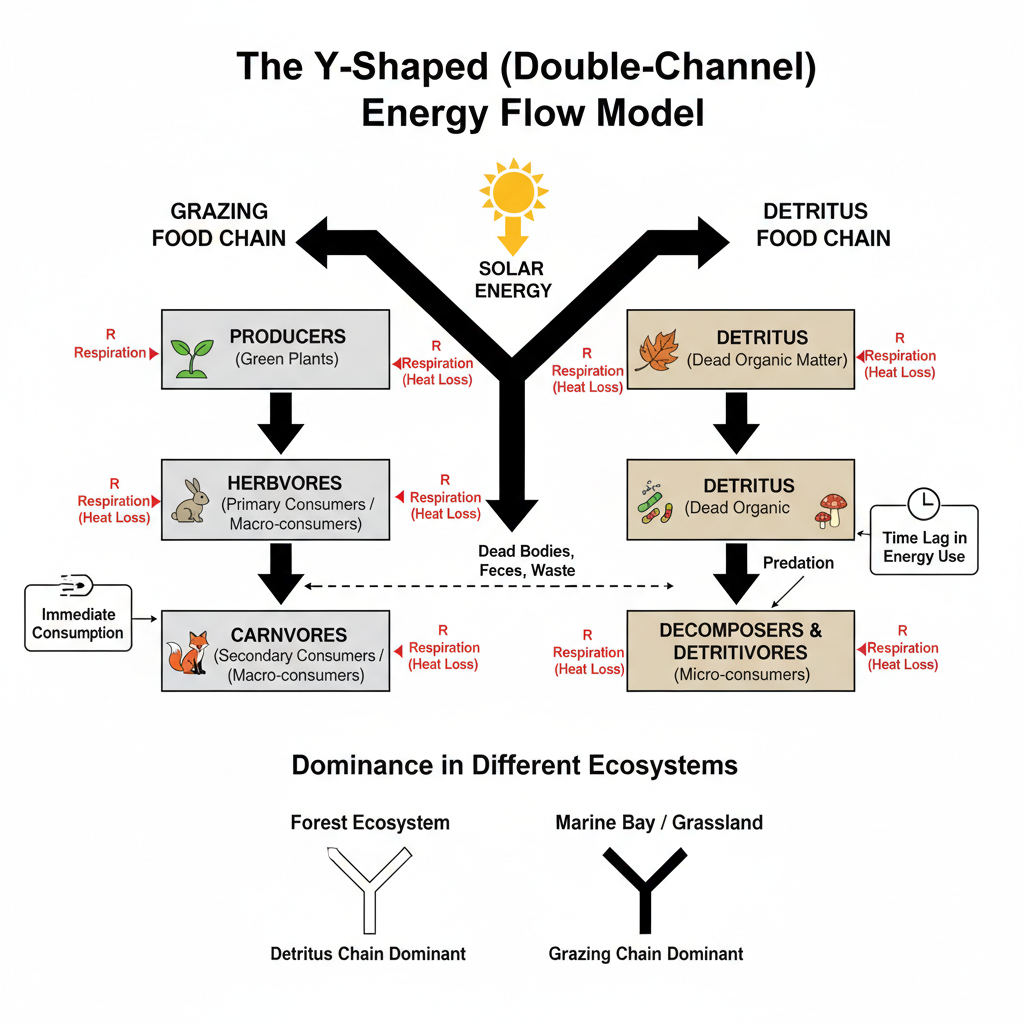
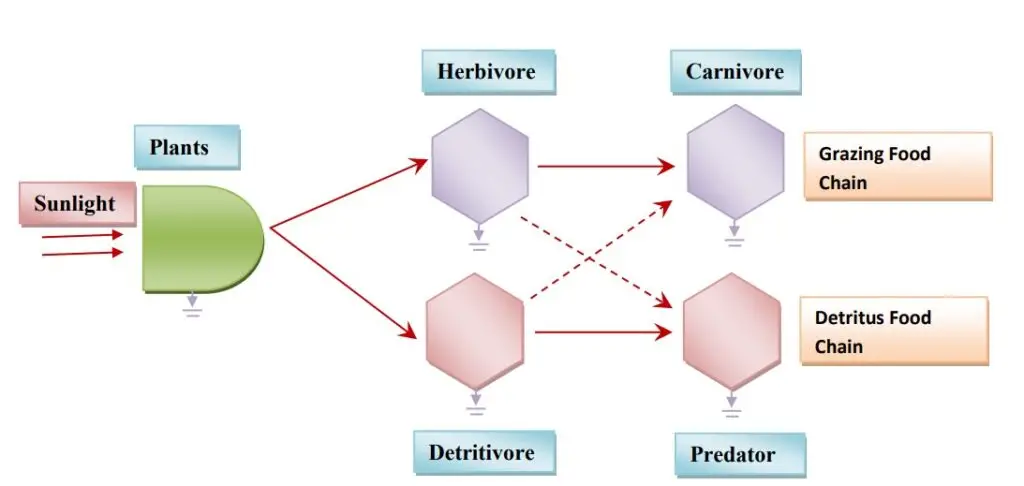
Y-shaped energy flow model is also called double channel energy flow model. This model shows two pathways of energy flow in an ecosystem. These are grazing food chain and detritus food chain.
In this model, one arm shows the grazing pathway. In this pathway, living green plants are eaten by herbivores and then energy passes to carnivores. Another arm shows the detritus pathway, where dead plants, dead animals and waste materials enter the decomposition process carried out mainly by bacteria and fungi.
This model is more realistic than single channel model. Because in nature, energy does not flow only through grazing food chain. A large part of plant and animal material become dead organic matter. Then it enters into the detritus food chain.
The two pathways are not fully separate. Dead bodies and waste materials from the grazing food chain enter into the detritus chain. So both channels are connected with each other. In marine ecosystem, grazing food chain is more important. But in forest and terrestrial ecosystem, detritus food chain is more dominant.
How the Y-Shaped (Double-Channel) Energy Flow Model Works?
- Energy input – The working of Y-shaped energy flow model starts with entry of sunlight into the ecosystem. This energy is trapped by primary producers or living green plants. They form organic matter by photosynthesis.
- Separation of energy pathway – After production, the energy flow is divided into two arms. One arm is grazing food chain and another arm is detritus food chain. So it is called double-channel energy flow model.
- Grazing channel – In this channel, energy passes through living plants. Herbivores eat the green plants and get energy. Then herbivores are eaten by carnivores. This pathway is mainly controlled by macro-consumers.
- Detritus channel – In this channel, energy passes through dead organic matter. Dead plants, dead animals and waste materials are used by decomposers. The main decomposers are bacteria and fungi. They are also called micro-consumers.
- Interconnection of two channels – The two channels are not fully separate in nature. Dead bodies and faeces of animals from grazing food chain enter into detritus food chain. So both pathways are connected with each other.
- Energy loss in both channels – During transfer of energy in both arms, some energy is lost as heat. This loss takes place due to respiration, decomposition and other metabolic activities. So energy becomes less in each step.
- Dominance of pathway – The importance of both channels is not same in all ecosystem. In marine ecosystem, grazing food chain is more active. In terrestrial forest ecosystem, detritus food chain is more important because large amount of plant material enter as dead organic matter.
Uses of Y-Shaped (Double-Channel) Energy Flow Model
- Y-shaped energy flow model is used to show the basic structure and function of an ecosystem. It includes both grazing food chain and detritus food chain at the same time.
- It is used to show two separate pathway of energy flow. One pathway is through living plants and another pathway is through dead organic matter.
- It helps to study the grazing channel. In this channel, herbivores directly eat green plants and then energy passes to carnivores.
- It helps to study the detritus channel. In this channel, dead plants, dead animals and waste materials are decomposed by bacteria and fungi.
- It is used to separate macro-consumers and micro-consumers. Macro-consumers are animals. Micro-consumers are mainly decomposers. Their size and metabolic activities are not same.
- It is used to show that food chains are not fully separate in nature. Dead bodies and faeces from grazing food chain enter into detritus food chain.
- It helps to understand the interconnection between living organisms and decomposers. The waste and dead materials of one channel become energy source for another channel.
- It is used to compare the dominant energy pathway in different ecosystem. In marine ecosystem, grazing food chain is more important. In terrestrial forest ecosystem, detritus food chain is more dominant.
Advantages
- Y-shaped energy flow model is more practical than linear energy flow model. It shows both grazing food chain and detritus food chain at the same time.
- It gives more real picture of ecosystem. Because in nature, energy flows through living plants as well as through dead organic matter.
- It helps to show the basic structure of ecosystem. The organisms are arranged in different trophic levels and both food chains are shown together.
- It separates the two pathway of energy flow. One is direct consumption of living plants and another is use of dead organic matter by decomposers.
- It shows the difference between macro-consumers and micro-consumers. Macro-consumers are mainly animals and micro-consumers are bacteria and fungi. Their size and metabolic rate are different.
- It shows that grazing food chain and detritus food chain are not fully separate. Dead bodies, faeces and waste materials from grazing chain enter into detritus chain.
- It helps to know which pathway is more dominant in different ecosystem. In marine ecosystem, grazing food chain is more dominant. In terrestrial forest ecosystem, detritus food chain is more dominant.
- It explains the role of decomposers more clearly. Bacteria and fungi break down dead organic matter and use the stored energy present in it.
Limitations
- Y-shaped energy flow model does not explain energy flow at very small level. It mainly shows the flow of energy through grazing food chain and detritus food chain. It does not clearly show energy use in a single organism or single population.
- It is not a universal model. This model is useful for showing two food chains, but it cannot be applied easily to every living component like individual, population or trophic group.
- It gives only general picture of energy flow. It does not show the exact amount of energy used in respiration, growth, reproduction and storage.
- It is still simple for a natural ecosystem. In nature, many organisms feed on different types of food. So complex food web is not fully shown in this model.
- It separates grazing pathway and detritus pathway, but in nature both are highly mixed. So clear separation of two channels is sometimes difficult.
- It does not explain the detailed bioenergetics of macro-consumers and micro-consumers. It only shows that they are different in size and metabolic rate.
- It does not show all types of energy loss clearly. Heat loss, unused food, excretory matter and stored energy are not divided in detailed way.
- It is less useful than universal energy flow model for studying energy flow in a particular organism or particular trophic level.
Universal Energy Flow Model
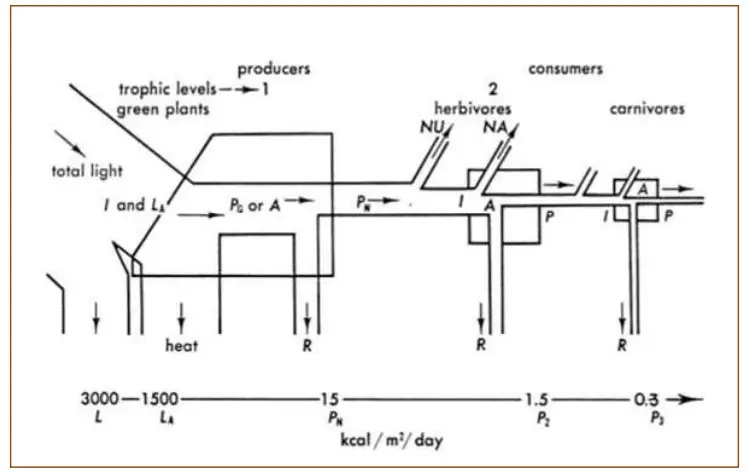
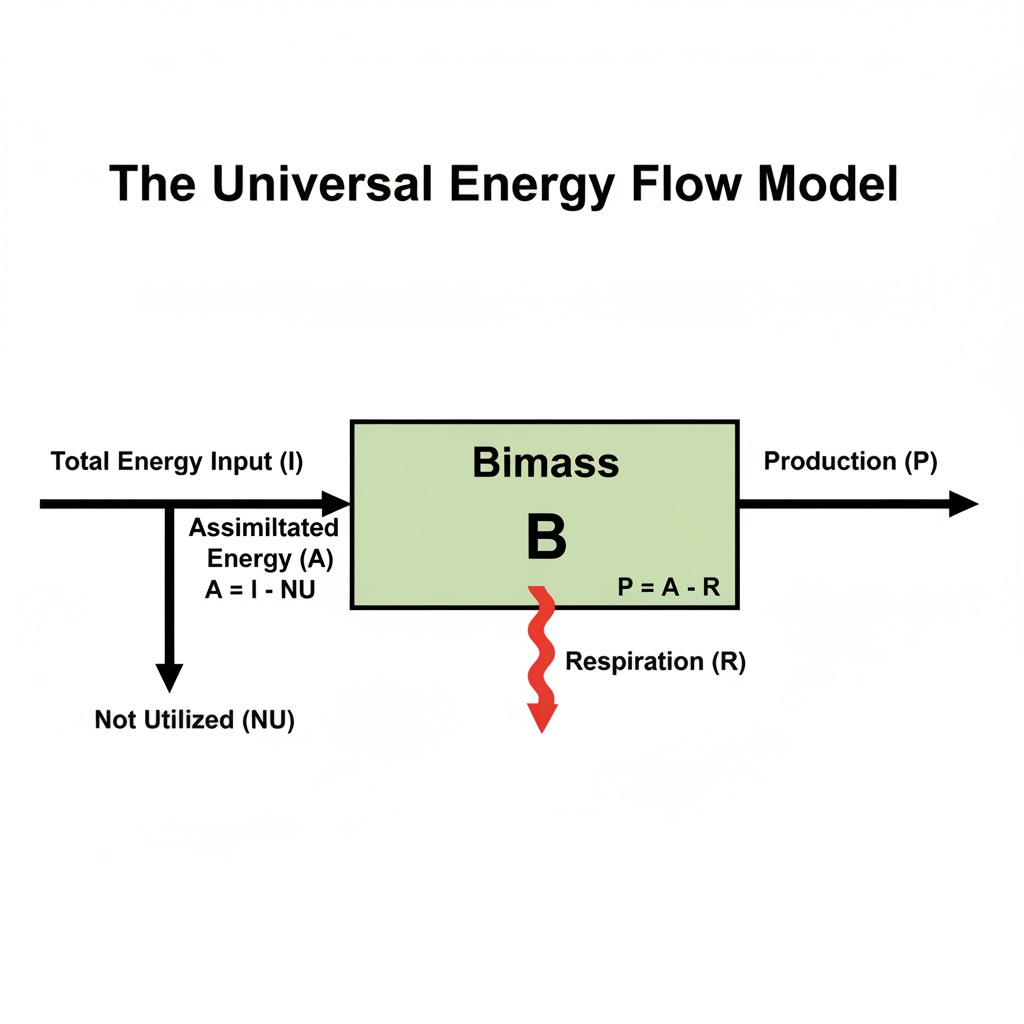
Universal energy flow model was introduced by E.P. Odum in 1968. This model is used to show the flow of energy in any living component of ecosystem. It can be applied to a single organism, population, trophic group or whole ecosystem.
In this model, total energy input may be solar energy or food energy. This energy is divided into assimilated energy and non-utilized energy. Non-utilized energy is the energy which is not used by the organism and it is passed out as waste or excretory matter.
The assimilated energy is again divided into two parts. One part is used in respiration for maintenance of life activities. This energy is lost as heat. Another part is stored as net production.
The net production is used for growth, reproduction and storage of body materials. So this model gives a general idea about input, use, loss and storage of energy in ecosystem.
How the Universal Energy Flow Model Works?
- Energy input (I) – The working of universal energy flow model starts with the entry of total energy into a living unit. In producers, this energy comes as absorbed solar radiation. In consumers, it comes as ingested food energy.
- First division of energy – The total energy input is divided into two parts. These are assimilated energy (A) and non-utilized energy (NU). Assimilated energy is the energy absorbed by the organism. Non-utilized energy is not absorbed and it passes out as waste.
- Assimilated energy – The energy which is absorbed by the body is called assimilated energy. This energy is used for different life activities of organism. It is again divided into respiration and net production.
- Respiration (R) – A major part of assimilated energy is used in respiration. It is needed for maintenance of body, movement and other metabolic activities. This energy is finally lost as heat to the environment.
- Net production (P) – The energy left after respiration is called net production. This energy is stored in the body of organism as biomass or standing crop. It represents the energy available for next trophic level.
- Growth and reproduction – The net production is used for growth and reproduction. Some energy is used to form new tissues and body materials. Some energy may be stored for future use.
- Universal application – This model can be applied to any living component of ecosystem. It may be single individual, population or whole trophic group. So it is called universal energy flow model.
Uses of Universal Energy Flow Model
- Universal energy flow model is used to give a general idea about energy flow in ecosystem. It explains how energy enters, used, lost and stored in living system.
- It is used to study the bioenergetics of any living component. It can be applied to single plant, animal, microorganism, population or whole trophic group.
- It is used to show the total energy input (I). In producers, this energy is mainly solar energy. In consumers, this energy is obtained from ingested food.
- It is used to show the division of energy into assimilated energy (A) and non-utilized energy (NU). Assimilated energy is absorbed by the organism and non-utilized energy passes out as waste.
- It helps to study the energy used in respiration (R). This energy is required for maintenance and metabolic activities. Finally it is lost as heat.
- It is used to show net production (P). Net production is the energy left after respiration. It is stored in the body as biomass.
- It helps to know the energy used in growth and reproduction. The stored energy forms new body material and also support reproductive activities.
- It is useful for studying whole ecosystem also. The model can be applied to food chain, population and whole ecosystem according to need.
Advantages
- Universal energy flow model can be applied to any living component of ecosystem. It may be single plant, animal, microorganism, population or whole trophic group.
- It is more flexible than other energy flow models. It can be used for a small unit like one organism and also for large unit like whole ecosystem.
- It gives detailed idea about energy use in living body. It shows how total energy input (I) is divided into assimilated energy (A) and non-utilized energy (NU).
- It helps to show the energy lost as respiration (R). This energy is used for maintenance and metabolic activities. After use it is lost as heat.
- It clearly shows the energy stored as net production (P). This stored energy is used for growth, reproduction and formation of new biomass.
- It is useful for studying bioenergetics of organisms. It shows input, absorption, loss and storage of energy in a simple way.
- It gives a general framework for explaining trophic energy flow. So it can be used in different types of food chain and ecosystem.
- It helps to compare energy flow in different living units. The same model can be used for producer, consumer or any trophic group.
Limitations
- Universal energy flow model gives only a general idea of energy flow. It cannot show all complex feeding relation present in natural ecosystem. In nature many organisms feed on more than one food source and form complex food web.
- It divides organisms into fixed trophic levels. But many animals are omnivores and they feed at different trophic level. Sometimes feeding habit also change with age, size and condition of organism.
- It may depend on average energy transfer efficiency. But energy transfer is not same in all ecosystem. It may vary from about 1% to more than 20% according to organism, habitat and environmental condition.
- It does not explain all non-trophic energy pathways clearly. In some ecosystem, much energy passes through dead organic matter, microbial loop and other detritus pathway. These pathway may be underestimated in this model.
- It groups many different species into one trophic group. But all species in same group do not have same respiration, growth and production rate. This may create wrong calculation of energy flow.
- It is difficult to measure all energy parts correctly. The values of energy input (I), assimilated energy (A), non-utilized energy (NU), respiration (R) and net production (P) are not always easy to calculate in field condition.
- It gives less detail about interaction between producers, consumers and decomposers. It shows energy partitioning in living unit, but does not show full ecosystem interaction in detailed way.
- It may become less accurate when applied to whole ecosystem. Because error in one trophic group may increase when it is added with other trophic groups.
Factors Affecting Energy Flow in an Ecosystem
Energy flow in an ecosystem is affected by different biotic and abiotic factors. These factors control the amount of energy trapped, transferred and lost in different trophic levels.
The factors affecting energy flow in ecosystem are-
- Solar radiation– Sunlight is the major source of energy in most ecosystem. The amount of solar radiation controls the energy captured by green plants. Low light intensity decreases photosynthesis and primary production.
- Primary productivity– The amount of energy entering into food chain depends on primary productivity. Higher plant production provides more energy to herbivores and other consumers. Low productivity reduces the energy available in higher trophic levels.
- Number of trophic levels– Energy decreases during movement from one trophic level to another. So food chain with more trophic levels has very less energy at the top. This limits the number of higher consumers.
- Energy transfer efficiency– The transfer of energy is not same in all ecosystem. It depends on the type of food, digestibility and metabolic activity of organisms. Generally only small amount of energy is transferred to next trophic level.
- Temperature– Temperature affects photosynthesis, respiration and metabolic activities. High temperature may increase respiration and more energy is lost as heat. Very low temperature slows down the activity of producers and consumers.
- Water availability– Water is needed for photosynthesis and growth of plants. Low water availability decreases plant production and less energy enters into the food chain. Excess water may also affect oxygen supply and decomposition.
- Nutrient availability– The growth of producers depends on nutrients such as nitrogen, phosphorus and minerals. Low nutrient availability reduces plant biomass and primary production. So less energy becomes available to consumers.
- Type and number of organisms– The organisms present in ecosystem control the pathway of energy flow. Herbivores, carnivores, omnivores and decomposers use energy in different ways. Their feeding habit and population size affect energy transfer.
- Decomposition rate– Decomposition controls the energy flow through detritus food chain. Bacteria and fungi use the energy stored in dead plants, dead animals and waste materials. Temperature, moisture and oxygen affect this process.
- Food quality– The energy obtained by consumers depends on the quality of food. Soft and nutritious food is digested more easily than hard and fibrous food. So assimilation of energy may be different.
- Human activities– Deforestation, pollution, overgrazing and excessive harvesting disturb the normal energy flow. These activities reduce producers, consumers or decomposers and change the feeding relationship of ecosystem.
Energy Flow and Ecosystem Productivity
Ecosystem productivity is the rate of production of organic matter in an ecosystem. It shows the amount of energy trapped and stored by organisms in a particular time.
The productivity of ecosystem is mainly of two types. These are primary productivity and secondary productivity.
Primary Productivity
Primary productivity is the rate of formation of organic matter by producers. Green plants trap sunlight and form food by photosynthesis. This food contains chemical energy.
Primary productivity is again divided into gross primary productivity (GPP) and net primary productivity (NPP).
Gross Primary Productivity (GPP)
Gross primary productivity (GPP) is the total amount of energy fixed by green plants during photosynthesis. It includes the total organic matter formed before respiration.
A part of this fixed energy is used by plants in respiration and other metabolic process.
Net Primary Productivity (NPP)
Net primary productivity (NPP) is the amount of energy left after respiration loss. This energy remains stored in plant body as biomass. It is available to herbivores.
The relation is as follows-
NPP = GPP – R
Where, R is the energy used in respiration.
Secondary Productivity
Secondary productivity is the rate of formation of new biomass by consumers. Herbivores obtain energy from plants. Carnivores obtain energy by feeding on other animals.
A part of food energy is used in respiration, movement and other metabolic activities. The remaining part is stored in the body for growth and reproduction.
Secondary productivity is less than primary productivity. Because much energy is lost during transfer from one trophic level to another.
Examples of Energy Flow in Different Ecosystems
Energy flow takes place in all ecosystems through producers, consumers and decomposers. The pathway may differ according to the organisms present in that ecosystem.
The following are some examples of energy flow in different ecosystems-
Energy Flow in Grassland Ecosystem
In grassland ecosystem, grasses are the main producers. They trap solar energy and prepare food by photosynthesis.
Grass is eaten by grasshopper or rabbit. These herbivores are eaten by frogs, snakes and other carnivores.
The energy flow is as follows-
Sun → Grass → Grasshopper → Frog → Snake → Hawk
Dead plants and animals are decomposed by bacteria and fungi.
Energy Flow in Pond Ecosystem
In pond ecosystem, phytoplankton and aquatic plants are the main producers. They trap sunlight and form food.
Phytoplankton are eaten by zooplankton. Zooplankton are eaten by small fishes and small fishes are eaten by large fishes.
The energy flow is as follows-
Sun → Phytoplankton → Zooplankton → Small fish → Large fish
Dead organisms and waste materials settle at the bottom. They are decomposed by microorganisms.
Energy Flow in Forest Ecosystem
In forest ecosystem, trees, shrubs and herbs are the main producers. They trap a large amount of solar energy.
Leaves and plant parts are eaten by deer, insects and other herbivores. These herbivores are eaten by tiger, snake, eagle and other carnivores.
The energy flow is as follows-
Sun → Green plants → Deer → Tiger
A large amount of plant material falls on the forest floor. Dead leaves, wood and animal waste enter into detritus food chain. So detritus pathway is important in forest ecosystem.
Energy Flow in Marine Ecosystem
In marine ecosystem, phytoplankton and marine algae are the main producers. They trap sunlight in the upper region of water.
Phytoplankton are eaten by zooplankton. Zooplankton are eaten by small fishes and these fishes are eaten by large predatory fishes.
The energy flow is as follows-
Sun → Phytoplankton → Zooplankton → Small fish → Large fish
The grazing food chain is more active in marine ecosystem. Dead organisms are also used by decomposers present in water and sediments.
Energy Flow in Desert Ecosystem
In desert ecosystem, cactus, shrubs and small grasses are the main producers. They trap solar energy and store it as chemical energy.
These plants are eaten by insects, rodents and other herbivores. They are then eaten by lizards, snakes and birds.
The energy flow is as follows-
Sun → Desert plants → Rodent → Snake → Hawk
The amount of productivity is low in desert ecosystem because water is less. So the total energy available to consumers is also less.
Difference Between Energy Flow and Nutrient Cycling
Energy flow and nutrient cycling are two important processes of an ecosystem. Energy moves through different trophic levels, but nutrients move between living organisms and environment.
The following are the main differences between energy flow and nutrient cycling-
| Energy Flow | Nutrient Cycling |
|---|---|
| Energy flow is unidirectional. | Nutrient cycling is cyclic. |
| Energy enters into ecosystem mainly from sunlight. | Nutrients are obtained from soil, water and atmosphere. |
| Energy moves from producers to consumers and decomposers. | Nutrients move between organisms and abiotic environment. |
| Energy is not recycled in ecosystem. | Nutrients are recycled again and again. |
| Much amount of energy is lost as heat during each transfer. | Nutrients are not lost as heat during their movement. |
| Continuous input of solar energy is needed. | Continuous external supply is generally not needed in the same way. |
| Energy decreases in each successive trophic level. | Nutrients return back to soil, water or atmosphere after decomposition. |
| Energy flow forms food chain and food web. | Nutrient cycling forms different biogeochemical cycles. |
| Examples are solar energy and chemical energy. | Examples are carbon cycle, nitrogen cycle and phosphorus cycle. |
Energy finally passes into environment as heat. Nutrients are returned back by decomposition and used again by producers.
Difference Between Linear, Y-Shaped and Universal Energy Flow Models
Differences between Universal, Linear and Double Energy Flow in a Ecosystem
| Basis | Linear Energy Flow Model | Double Energy Flow Model | Universal Energy Flow Model |
|---|---|---|---|
| Other name | It is also called single channel energy flow model. | It is also called Y-shaped energy flow model or double channel model. | It is called universal model because it can be applied to any living component. |
| Main idea | It shows energy flow in one straight pathway. | It shows energy flow in two pathways. | It shows how energy is used, lost and stored inside a living unit. |
| Pathway | Energy flows from producers to herbivores and then to carnivores. | Energy flows through grazing food chain and detritus food chain. | Energy is divided after it enters into organism or trophic unit. |
| Food chain shown | It shows only one food chain. It is simple and linear. | It shows two food chains together. One is living plant pathway and another is dead matter pathway. | It does not mainly show food chain. It shows energy budget of organism. |
| Application | It is used to show energy flow in a community in simple way. | It is used to show energy flow in ecosystem with two connected channels. | It can be applied to single organism, population, trophic group or whole ecosystem. |
| Consumers | Consumers are arranged in one line. It does not separate consumer types clearly. | Macro-consumers and micro-consumers are shown separately. | Energy use of any producer or consumer can be studied. |
| Detritus pathway | Detritus food chain is not shown properly. | Detritus food chain is clearly shown. | It may be applied to detritus organisms also, but mainly shows energy partitioning. |
| Energy loss | It shows gradual loss of energy at each trophic level. | It shows energy loss in both grazing and detritus channel. | It shows energy loss mainly as respiration (R) and heat. |
| Energy storage | Stored energy decreases from producers to carnivores. | Stored energy is present in living biomass and dead organic matter. | Stored energy is shown as net production (P). |
| Realistic nature | It is less realistic because it shows only one pathway. | It is more realistic because it includes decomposition also. | It is useful for detailed study of energy budget. |
| Dominance of pathway | It cannot show which energy pathway is dominant. | It can show dominance of grazing chain in marine ecosystem and detritus chain in forest ecosystem. | It is used to study efficiency like assimilation efficiency and production efficiency. |
| Main limitation | It over-simplifies the food relation. | It cannot show exact energy partition inside a single organism. | It cannot show full complex food web and all interactions clearly. |
References
- Allard, D. W. (2021). Lindeman’s The Trophic-Dynamic Aspect of Ecology Is Published. EBSCO Research Starters.
- Amina. (n.d.). Describe the 10% rule in energy transfer. TutorChase.
- Biology LibreTexts. (n.d.). 14: Energy in Ecosystems.
- Biology LibreTexts. (n.d.). 46.2D: Ecological Pyramids.
- bpedit. (2017, February 20). Explanation of universal model of energy flow. Biology Stack Exchange.
- Brown, M. T. (2004). A picture is worth a thousand words: Energy systems language and simulation. Ecological Modelling, 178(1-2), 83–100.
- Choudhary, R. (n.d.). ENERGY FLOW MODELS [PDF document]. SlideShare.
- Concepts in Biology. (n.d.). 12.1 Ecosystems, Food Chains, and Food Webs. LMU Pressbooks.
- Concepts in Biology. (n.d.). 12.2 Energy Flow Through Ecosystems. LMU Pressbooks.
- Cook, R. E. (1977). Raymond Lindeman and the Trophic-Dynamic Concept in Ecology. Science, 198(4312), 22–26.
- Dziak, M. (2017). Ecological pyramid. EBSCO Research Starters.
- Environmental Protection Agency. (n.d.). Food Chains and Food Webs [PDF document].
- Environmental Studies (EVS) Institute. (n.d.). Exploring Ecological Pyramids: Numbers, Biomass, and Energy.
- Environmental Studies (EVS) Institute. (n.d.). How Energy Flows Through Ecosystems.
- GeeksforGeeks. (2025, July 23). Difference Between Grazing and Detritus Food Chain.
- Generation Genius. (n.d.). Food Webs and Food Chains for Kids | Science Lesson for Grades 3-5.
- Grokipedia contributors. (n.d.). Ecological efficiency. Grokipedia.
- Grokipedia contributors. (n.d.). Raymond Lindeman. Grokipedia.
- Introduction to Global Change. (2017, October 20). The Flow of Energy from Primary Production to Higher Tropic Levels. University of Michigan.
- Johnstone, I. M. (2019, May 24). Energetic Symbols. Issues of Sustainability.
- Kemp, W. M., & Boynton, W. R. (2004). Productivity, trophic structure, and energy flow in the steady-state ecosystems of Silver Springs, Florida. Ecological Modelling, 178(1-2), 43–49.
- Khan, S. (n.d.). Flow of energy and matter through ecosystems [Video]. Khan Academy.
- Khan Academy. (n.d.). Energy flow & primary productivity.
- Khan Academy. (n.d.). Learn: Food chains & food webs.
- Khan Academy. (n.d.). Learn: Trophic levels and energy loss.
- Knight, R. L., & Kaplan, D. (2022, August 1). Howard T. Odum expanded knowledge about springs, ecosystems, wetlands and energy. Florida Springs Institute.
- Kumari, B. (n.d.). Energy flow through the Ecosystem [PDF document]. Hooghly Women’s College.
- Legacy IAS. (2026, April 4). Food Chain & Food Web — Grazing & Detritus UPSC Notes.
- Lindeman, R. L. (1942). The Trophic-Dynamic Aspect of Ecology. Ecology, 23(4), 399–418.
- LumiSource. (2026, February 26). Topic 1.10 Notes – Energy Flow and the 10% Rule (APES).
- Marjot, A. (n.d.). Energy Transfers in Ecosystems (College Board AP® Environmental Science): Revision Note. Save My Exams.
- NGS Magnified. (n.d.). Section 2: Energy Flow in Ecosystems.
- Odum, H. T. (1972). An energy circuit language for ecological and social systems: Its physical basis. In B. Patten (Ed.), Systems Analysis and Simulation in Ecology (Vol. 2, pp. 139–211). Academic Press.
- Odum, H. T. (1977). THE ECOSYSTEM, ENERGY, AND HUMAN VALUES. Zygon, 12(2), 109–133.
- Odum, H. T., & Odum, E. C. (1989). Energy Systems in Ecology. Systems & Control Encyclopedia.
- PMC. (n.d.). All wet or dried up? Real differences between aquatic and terrestrial food webs.
- PMC. (n.d.). Variation in food web reliance on green and brown energy pathways across ecosystem gradients.
- Publishing Services. (n.d.). Waterford’s Energy Flow Through Ecosystems – Introductory Biology.
- QuickTakes. (n.d.). Student Question: How does energy flow differ between terrestrial and aquatic ecosystems?
- Raymond. (n.d.). How does energy flow differ in aquatic and terrestrial ecosystems? TutorChase.
- ResearchGate. (n.d.). (a) A universal energy diagram according to E.P. Odum [Image].
- ResearchGate. (n.d.). Lindeman Publishes “The Trophic-Dynamic Aspect of Ecology”.
- SATHEE Forum. (n.d.). Compare energy transfer efficiency between grazing and detritus food chains? SATHEE.
- Sobczak, W. V. (2005). LINDEMAN’S TROPHIC- DYNAMIC ASPECT OF ECOLOGY: “WILL YOU STILL NEED ME WHEN I’M 64?”. Limnology and Oceanography Bulletin, 14(3), 53–57.
- Socio.Health. (2025, December 4). The Laws of Thermodynamics and Energy Flow in Ecosystems.
- Sterner, R. W. (n.d.). Raymond Laurel Lindeman and the Trophic Dynamic Viewpoint [PDF document]. College of Biological Sciences.
- Testbook. (n.d.). Understanding the Difference Between Grazing and Detritus Food Chain.
- Valerie. (2021, August 6). Food Chains vs Food Webs: definitions, differences explained, and examples. Wild Earth Lab.
- Wheeler, C., & Robb, A. (n.d.). Biomass Pyramid | Definition, Examples & Function. Study.com.
- Wikipedia contributors. (2026, January 28). Detritivore. Wikipedia, The Free Encyclopedia.
- Wikipedia contributors. (2026, April 6). Energy systems language. Wikipedia, The Free Encyclopedia.
- Wikipedia contributors. (2026, April 18). Howard T. Odum. Wikipedia, The Free Encyclopedia.
- (Author, n.d.). Energetic Foundations of Ecological Systems: A Comprehensive Analysis of Trophic Dynamics and Energy Flow Modeling (Internal Markdown document).