

Flow cytometry is a laser based analytical technique used to measure physical and chemical characters of cells or particles present in a fluid. In this method, cells pass one by one through a laser beam. The scattered light and fluorescence signals are detected and analysed.
Flow cytometry is a laser based technique. It is used to study cells or particles present in a fluid. It can measure physical and chemical characters of single cells.
In this method, the cell suspension is passed through the instrument. The cells pass one by one through a focused laser beam. When laser falls on the cell, light is scattered.
The scattered light gives information about the cell. Forward scatter shows relative size of the cell. Side scatter shows internal complexity or granularity of the cell.
Cells may also be labelled with fluorescent dyes or fluorescent antibodies. When laser strikes these labelled cells, they emit fluorescent light. This light is collected by detectors.
The signals are changed into electronic data. By this, many characters of cells can be measured at the same time. Surface proteins, intracellular proteins, cell size and granularity can be detected.
Flow cytometry is rapid technique. It can analyse thousands to millions of cells in short time. It is useful for counting cells, sorting cells and studying immune cells.
It is commonly used in diagnosis of blood disorders and cancers. Leukemia and lymphoma can be studied by this method. It is also used for immune function test and single cell analysis.
Principle of Flow Cytometry
Principle of Flow Cytometry is based on the measurement of light scattering and fluorescence emission from cells. The cells are suspended in fluid. They pass one by one through a focused laser beam.
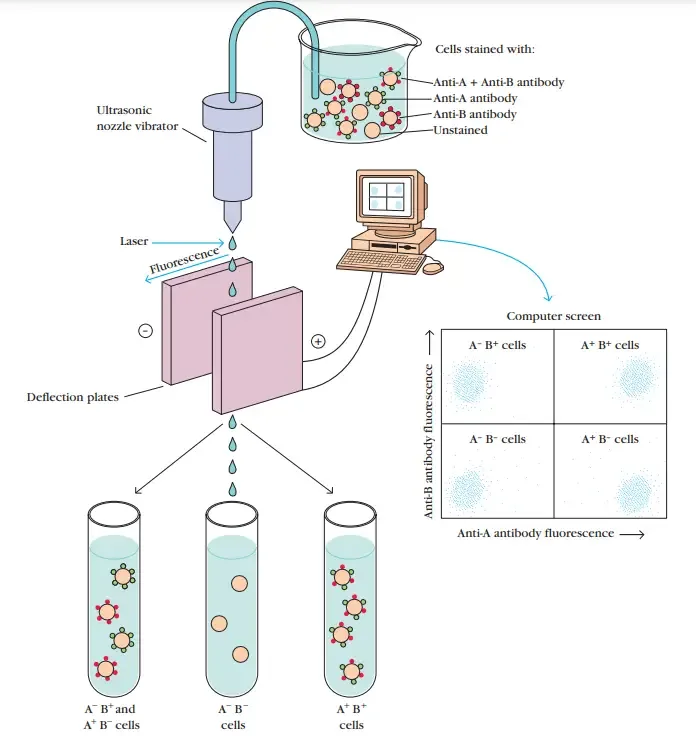
In this technique, the fluid system arranges the cells in a single line. This is done by hydrodynamic focusing. A sheath fluid surrounds the sample fluid and pushes the cells into narrow stream.
When each cell passes through the laser beam, light is scattered. The light scattered in forward direction is called forward scatter (FSC). It gives information about relative size of the cell.
The light scattered at side direction is called side scatter (SSC). It gives information about internal complexity of the cell. Granules and internal structures increase the side scatter signal.
Cells may be labelled with fluorescent dyes or fluorescent antibodies. The laser excites these fluorochromes. Then they emit fluorescent light at longer wavelength.
The scattered light and fluorescent light are collected by lenses and filters. These signals are passed to specific detectors. Then electronic system converts the light signals into digital data.
The digital data is analysed by computer. By this, cell size, granularity and presence of specific surface or intracellular marker can be detected.
History and Development of Flow Cytometry
Flow cytometry developed slowly from microscopy, fluid physics, electrical cell counting and fluorescence detection. Many scientists contributed in different stages. Later it became an important method for cell analysis and cell sorting.
- Early foundation
The early history is related with development of microscopy. Antonie van Leeuwenhoek is often considered as an early starting point. In the 1800s, Lord Rayleigh observed that a liquid stream coming from small opening becomes unstable and breaks into droplets. This idea later helped in droplet based cell sorting. - First detection apparatus
In 1947, F.T. Gucker made the first apparatus for detection of bacteria. It used a laminar sheath stream of air. This was an early step for detecting particles in flowing stream. - Coulter counter
In late 1940s and early 1950s, Wallace Coulter developed the Coulter counter. It was the oldest automated method for cell analysis. It was based on Coulter principle. In this method, cell volume was measured by change in electrical impedance when cells passed through a small aperture. - Droplet charging method
In 1965, Richard Sweet developed drop charging and deflection technique for ink-jet printing. This method was later used in cell sorters. It helped to stabilize droplet formation of liquid jet by using ultrasonic transducer. - First automated cell sorter
In 1965, Mack Fulwyler made the first automated cell sorter. He combined Coulter volume measurement with electrostatic droplet deflection. At same time, Louis Kamentsky also described a cell sorter based on fluidic switching. - Light scatter and fluorescence detection
In late 1960s and early 1970s, new detection systems were developed. Wolfgang Göhde, Louis Kamentsky and Len Herzenberg were important workers. They added light scatter and fluorescence detection. This made cytometry more useful for cell characterization. - Development of FACS
In 1972, Len Herzenberg group at Stanford University developed a cell sorter. It could separate cells stained with fluorescent antibodies. This group used the term Fluorescence-Activated Cell Sorter (FACS). - Mass cytometry
In 2009, Bandura et al. introduced mass cytometry. It is also called cytometry by Time-Of-Flight (CyTOF). In this method, metal isotopes are used instead of fluorescent labels. It allowed many more parameters to be analysed at the same time.
Basic Components of a Flow Cytometer
Flow cytometer has three main systems. These systems work together for passing of cells, striking of laser and detection of signals. The main parts are fluidics system, optics system and electronics system.
- Fluidics system
Fluidics system carries the sample from the tube to the laser point. The cells are present in fluid suspension. A fast moving sheath fluid surrounds the sample fluid. This makes the cells pass in single line. This process is called hydrodynamic focusing. - Optics system
Optics system produces and collects light signals. It has lasers of specific wavelength. The laser light falls on the cells one by one. After this, scattered light and fluorescent light are produced. Lenses, mirrors and filters direct these lights to proper detectors. - Electronics system
Electronics system receives the optical signals. Detectors like photomultiplier tubes (PMTs) collect photons. These light signals are changed into electrical signals. Then the signals are converted into digital data and sent to computer for analysis.
Working Mechanism of Flow Cytometry
Flow cytometry works by passing cells one by one through a laser beam. The scattered light and fluorescence are detected. Then the signals are converted into data.
- Sample preparation
The cell sample is first prepared. Blood, bone marrow or other cell suspension may be used. The cells are suspended in fluid. They may be labelled with fluorescent dyes or fluorescent antibodies. - Hydrodynamic focusing
The sample enters into the fluidics system. A fast moving sheath fluid surrounds the sample. It pushes the cells into a narrow stream. Due to this, cells pass one by one through the laser point. - Laser exposure
The single line of cells passes through focused laser beam. When laser strikes each cell, light is scattered. If fluorescent label is present, it also becomes excited. Then fluorescent light is emitted. - Forward scatter
Forward scatter (FSC) is the light scattered in forward direction. It gives idea about relative size of the cell. Larger cells usually give more forward scatter. - Side scatter
Side scatter (SSC) is the light scattered at side direction. It gives idea about internal complexity of the cell. Granules and internal structures increase this signal. - Fluorescence detection
Fluorescent antibodies bind with specific cell markers. When laser excites them, they emit light at longer wavelength. This helps to identify surface or intracellular proteins. - Signal collection
The scattered and fluorescent lights are collected by optical system. Lenses, mirrors and filters are used. These parts send specific wavelength of light to proper detector. - Signal conversion
Detectors such as photomultiplier tubes (PMTs) receive the light signals. These optical signals are changed into electrical signals. The electrical signals are formed as voltage pulses. - Data analysis
The electrical signals are digitized and sent to computer. Software analyses the data. Results are shown as dot plots, histograms or other graphs. By this, different cell populations are counted and studied. - Cell sorting
Some flow cytometers can also sort cells. Desired cells are trapped in small liquid droplets. These droplets are given electrical charge. Then electric field separates them into different collection tubes.
Light Scatter in Flow Cytometry
Light scatter is produced when laser light strikes the cell. The light is scattered in different direction. This scattered light gives information about cell size and internal granularity.
- Forward scatter (FSC)
Forward scatter (FSC) is the light scattered in forward direction. It is measured in same axis of laser beam. It is usually measured at small angle, about 0.5° to 10°.- a. Detector
It is mainly collected by silicon photodiode. - b. Measurement
It gives information about relative cell size. It also depends on cross-sectional area and surface area of the cell. Refractive index also affects this signal. - c. Use
It helps to separate intact cells from dead cells and debris. Dead cells and fragments usually show low FSC.
- a. Detector
- Side scatter (SSC)
Side scatter (SSC) is the light scattered at side direction. It is measured at wide angle. Usually it is measured at 90° to the laser beam.- a. Detector
It is collected by sensitive photomultiplier tube (PMT). - b. Measurement
It gives information about internal complexity of cell. Cytoplasmic granules, vacuoles and multi-lobed nucleus increase SSC. - c. Use
It helps to detect granular cells. Granulocytes show high SSC. Less complex cells show low SSC.
- a. Detector
- Combined use of FSC and SSC
FSC and SSC are used together in flow cytometry. Both signals are plotted in FSC vs SSC graph. This helps to identify different cell populations in mixed sample.- a. Cell discrimination
Different cells have different scatter pattern. So cells can be separated without fluorescent probe also. - b. Blood cell separation
In blood sample, lymphocytes, monocytes and granulocytes can be separated. Lymphocytes are small and less granular. Monocytes are larger. Granulocytes show high granularity and high SSC.
- a. Cell discrimination
Fluorescence and Fluorochromes Used in Flow Cytometry
Fluorescence is the emission of light by a fluorochrome after absorption of laser light. Fluorochromes are fluorescent dyes. They are used to label cells, antibodies or cellular molecules in flow cytometry.
- Mechanism of fluorescence
When a fluorochrome absorbs photons from laser, its molecules become excited. The molecule moves from ground state to excited state. After short time, it returns back to lower energy state. During this return, energy is released as heat and fluorescent light. - Stokes shift
Some absorbed energy is lost as heat. So emitted light has less energy than excitation light. The emitted light has longer wavelength. This difference between excitation and emission wavelength is called Stokes shift. - Spectral property
Each fluorochrome has its own excitation and emission spectrum. It absorbs light best at one wavelength. It emits strongest light at another wavelength. So different fluorochromes can be detected separately. - Target detection
Cells are stained with fluorescent dyes or labelled antibodies. These dyes bind with specific target molecule. When laser excites the dye, fluorescence is produced. More target molecule gives more fluorescence intensity. - Antibody conjugation
Fluorochromes are commonly attached with antibodies. These are called fluorescent antibody conjugates. The antibody binds with specific antigen like CD markers. By this, different cell populations can be identified. - Functional dyes
Some fluorescent dyes are used to study cell function. Propidium iodide (PI) enters only dead cells and binds with DNA. Rh123 is used for mitochondrial membrane potential. Indo-1 AM is used for intracellular calcium level. - Tandem fluorophores
Tandem fluorophores are made by joining two fluorochromes. They are useful in multi-colour flow cytometry. But their emission may vary between different lots. So they need careful setting and control. - Spectral overlap
Fluorochromes do not emit light at single point only. They emit light over a broad range of wavelength. So emission from one fluorochrome may enter another detector. This is called spectral overlap. - Compensation
Compensation is used to correct spectral overlap. It subtracts unwanted signal from other detector. This helps to measure the correct fluorescence from intended fluorochrome. - Spectral unmixing
In spectral flow cytometry, spectral unmixing is used. It separates overlapping fluorescence signals by mathematical method. It helps to identify each fluorochrome correctly in multi-colour panel.
Sample Preparation for Flow Cytometry
Sample preparation is an important step in flow cytometry. The sample should contain single cells in fluid. Clumps and debris should be removed before running in the instrument.
- Specimen collection
Blood and bone marrow samples are collected in EDTA or heparin tubes. These tubes prevent clotting of sample. Solid tissue cannot be used directly. It is first broken into single cell suspension. - Solid tissue preparation
Solid tissue is processed by mechanical dissociation or enzymatic digestion. This helps to separate the cells from tissue mass. The final sample should have single cells. Large tissue pieces should not remain. - Timing of processing
Fresh sample gives better result. It should be processed within 18 hours if possible. Usually it should not be delayed more than 48 hours. Delay can reduce cell viability. - Cell concentration
Cells are suspended in cold staining buffer. The usual cell density is 10⁶ to 10⁷ cells/mL. Proper concentration is needed for good staining and proper flow of cells. - Filtration
The sample is passed through cell strainer or mechanical filter. This removes cell clumps and debris. Clumps can block the narrow fluidic system of flow cytometer. So filtration is necessary. - Cell enrichment
Enrichment is done when rare cells are to be detected. Immunomagnetic cell sorting may be used. Density gradient method like Ficoll may also be used. This increases the number of target cells before staining. - Staining of cells
Cells are incubated with fluorochrome labelled antibodies. These antibodies bind with specific cell markers. This step helps to identify different cell populations. Proper incubation time and temperature should be maintained. - RBC lysis
In blood sample, red blood cells are removed by lysis buffer. This is called stain-lyse-wash method. After lysis, the sample is washed. Then centrifugation is done to remove extra reagent and debris. - Washing step
Washing removes unbound antibodies and lysis chemicals. The sample is centrifuged and supernatant is discarded. The cell pellet is resuspended in buffer. This gives clean cell suspension. - Permeabilization
If the target antigen is inside the cell, permeabilization is required. The cell membrane is made permeable. Then antibodies can enter inside the cell. This is used for intracellular protein detection.
Step by Step Procedure of Flow Cytometry
Flow cytometry procedure is done by preparing the cell suspension, staining the cells and passing them through laser beam. The signals are collected and analysed by computer. Cell sorting may be done if FACS instrument is used.
- Specimen collection
The sample is first collected. Blood, bone marrow, body fluid or solid tissue may be used. Blood and bone marrow are usually collected in anticoagulant tube. - Preparation of single cell suspension
The sample should contain single cells. Solid tissue is broken by mechanical dissociation or enzymatic digestion. This separates the cells from tissue mass. The cells are suspended in suitable buffer. - Filtration of sample
The cell suspension is passed through mechanical filter or cell strainer. This removes cell clumps and debris. It prevents blocking of the narrow fluidic system of flow cytometer. - Cell staining
The single cell suspension is incubated with fluorochrome-labelled antibodies. These antibodies bind with specific cell targets. The target may be surface antigen or intracellular antigen. - RBC lysis and washing
For blood and bone marrow sample, lysis buffer is added. It destroys red blood cells. Then the sample is washed and centrifuged. This removes extra antibody, lysed cells and other unwanted materials. - Permeabilization
If the target antigen is present inside the cell, permeabilization is done. The cell membrane is made permeable. Then antibodies can enter into the cell and bind with intracellular antigen. - Sample injection
The prepared sample is introduced into the flow cytometer. The cells enter into the fluidics system. The sample starts moving toward the laser point. - Hydrodynamic focusing
A fast moving sheath fluid surrounds the sample fluid. This process is called hydrodynamic focusing. It makes the cells arranged in a narrow single line. So cells pass one by one. - Laser interrogation
The single file cells pass through focused laser beam. Laser light strikes each cell. The light is scattered and fluorescent dyes are excited. Fluorescent light is emitted from labelled cells. - Light scatter detection
Forward scatter (FSC) gives information about cell size. Side scatter (SSC) gives information about granularity and internal complexity. These two signals help to separate different cell populations. - Fluorescence detection
The fluorescently labelled antibodies emit light at different wavelength. Optical lenses and filters separate the light. Then the light is directed to proper detectors. - Signal conversion
Detectors capture the scattered light and fluorescent light. These optical signals are changed into electrical voltage pulses. Then the electronics system converts them into digital signals. - Data analysis
The digital data is sent to computer. Software shows data as histogram or dot plot. Different cell populations are identified from these plots. - Gating
Gating is done by drawing boundary around selected cell population. It helps to remove debris, dead cells and doublets. The required cell population is then counted and analysed. - Cell sorting
In FACS, selected cells can be physically separated. The cells are enclosed in liquid droplets. Droplets containing selected cells are given electric charge. Then electric field deflects them into separate collection tubes.
Data Analysis and Interpretation in Flow Cytometry
Data analysis in flow cytometry is done after collection of scatter and fluorescence signals. The signals are converted into digital data. Then computer software is used for graph formation, gating and interpretation.
- Data storage
The data is stored in Flow Cytometry Standard (.fcs) file. It is stored in listmode format. In this format, data of every single cell is stored separately.- a. Cell event
Each cell passing through laser is called one event. - b. Stored parameters
FSC, SSC and fluorescence values are stored for every event.
- a. Cell event
- Data visualization
The stored data is shown by different graphs. These graphs help to see cell populations clearly.- a. Histogram
Histogram is one parameter graph. X-axis shows scatter or fluorescence intensity. Y-axis shows number of cells. - b. Dot plot
Dot plot is two parameter graph. One parameter is on X-axis and another on Y-axis. Each dot represents one cell. - c. Density and contour plot
Density plot shows crowded cells by colour. Contour plot shows cell density by lines. These are useful when many cells overlap.
- a. Histogram
- Gating strategy
Gating is the selection of required cell population. Boundary is drawn around selected cells. Then only these cells are analysed further.- a. Debris exclusion
FSC and SSC are used first. Small debris and machine noise are removed. It gives clean cell population. - b. Doublet discrimination
Doublets are clumped cells passing together. Scatter area is compared with height or width. By this, single cells are separated. - c. Dead cell exclusion
Dead cells are removed by viability dyes. Propidium iodide (PI) is one example. Dead cells may bind antibodies non-specifically and give false positive result. - d. Target cell isolation
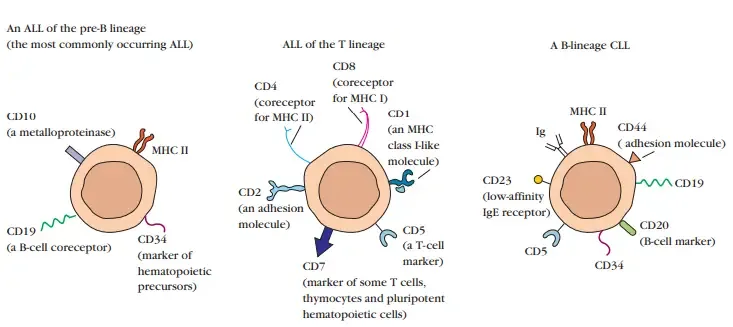
Specific markers are used for selecting target cells. T cells, B cells and NK cells can be separated by their surface markers. Intracellular markers may also be used.
- a. Debris exclusion
- Compensation and unmixing
Fluorochromes emit light over broad wavelength range. So one fluorochrome signal may enter another detector. This overlapping signal should be corrected.- a. Compensation
Compensation is used in conventional flow cytometry. It subtracts spillover signal from wrong detector. - b. Spectral unmixing
Spectral unmixing is used in spectral flow cytometry. It separates overlapping fluorescence signals by mathematical method.
- a. Compensation
- FMO control
Fluorescence minus one (FMO) control is used for proper gate setting. In this control, all fluorochromes are added except one.- a. Use of FMO
It shows background signal and spillover. - b. Gate setting
It helps to decide where negative population ends and positive population starts.
- a. Use of FMO
- Statistical interpretation
After gating, software calculates the values. These values are used for final interpretation.- a. Percentage of cells
It shows how many cells are positive for a marker. - b. Mean fluorescence intensity
Mean fluorescence intensity (MFI) shows average fluorescence of selected cells. - c. Cell count and DNA data
Exact cell count, DNA content and replication related values may also be measured.
- a. Percentage of cells
- Advanced analysis
Advanced analysis is used when many markers are used together. It is common in mass cytometry and spectral flow cytometry.- a. Clustering
FlowSOM and PhenoGraph group cells according to phenotype. - b. Dimensionality reduction
tSNE and UMAP show complex data in two dimensional plot. It helps to see relation between different cell populations.
- a. Clustering
Applications of Flow Cytometry in Immunology and Cell Biology
Flow cytometry is used in immunology and cell biology for study of different cells. It can identify cells, count cells and measure their function. It is also used in diagnosis of many blood and immune disorders.
- It is used for immunophenotyping. In this method, fluorescent antibodies bind with surface or intracellular markers. Different cell populations like T cells, B cells, NK cells and monocytes can be identified and counted.
- It is used to know cell lineage and activation status. Activation markers can be detected on immune cells. It also helps to study movement or migration ability of cells.
- It is an important method for diagnosis of blood cancers. Leukemia and lymphoma can be classified by using cell markers. Abnormal cell population can be separated from normal cells.
- It is used for functional assay of cells. The response of cells to stimulation can be measured. Intracellular cytokines, intracellular calcium, intracellular pH, ROS and protein phosphorylation can be detected.
- It is used for cell cycle and DNA analysis. Fluorescent DNA-binding dyes are used. Cells in G0/G1, S and G2/M phase can be studied. Abnormal DNA content and aneuploidy can also be detected.
- It is used for cell proliferation study. Cell division can be followed by fluorescent dyes like CFSE. This dye becomes reduced in each daughter cell after division. So number of cell divisions can be measured.
- It is used to detect apoptosis and necrosis. Annexin V is used for early apoptosis. Propidium iodide (PI) enters dead cells and shows loss of membrane integrity. By this, programmed cell death and damaged cell death can be separated.
- It is used for cell sorting by FACS. Specific cells are identified by markers and then physically separated. Sorted cells can be collected in tubes. These cells can be used for culture, molecular study and further experiments.
- It is used for clinical immune monitoring. CD4+ T lymphocyte count is measured in HIV/AIDS. This helps to know progression of disease and immune status of patient.
- It is used in diagnosis of some special disorders. Paroxysmal nocturnal hemoglobinuria (PNH) can be diagnosed. HLA-B27 screening can be done in suspected ankylosing spondylitis.
- It is used for detection of minimal residual disease (MRD). This is important in leukemia treatment follow up. Very small number of remaining cancer cells can be detected. It helps to know whether treatment is working or not.
Advantages of Flow Cytometry
Flow cytometry has many advantages in cell analysis. It can study single cells in a fluid suspension. It gives rapid and specific information about different cell populations.
- Flow cytometry is a very rapid technique. It can analyse thousands of cells in one second. Some instruments can collect up to 50,000 events per second. So large number of cells are studied in short time.
- It gives information at single cell level. Each cell is measured separately. It does not give only average value of whole sample. So small difference between cells can be detected.
- It can detect rare cell populations. Large number of cells are processed quickly. So very small number of abnormal or special cells can be found in mixed sample. This is useful in minimal residual disease (MRD) detection.
- It can measure many parameters at the same time. Cell size, granularity and many surface or intracellular markers can be detected together. This is called multiparametric analysis.
- It gives high statistical power. Thousands to millions of cell events can be collected. So the result becomes more reliable. It is useful in research and clinical diagnosis.
- It gives quantitative result. Fluorescence intensity can be measured. This shows amount of marker present on or inside the cell. So marker expression can be compared between cell populations.
- It is specific because fluorescent antibodies bind with selected antigen. Different CD markers and intracellular proteins can be detected. By this, exact cell type can be identified.
- It can also sort living cells. In FACS, selected cells are separated into different tubes. These sorted cells can be used for culture, molecular study and further experiment.
- It is useful in routine laboratory work. Conventional flow cytometry is less costly than some advanced single cell methods. It is more accessible than mass cytometry and single-cell RNA sequencing in many laboratories.
Limitations of Flow Cytometry
Flow cytometry is a useful technique. But it has some limitations also. These limitations are related with sample preparation, instrument cost, data analysis and safety.
- Flow cytometry needs single cell suspension. It cannot directly analyse solid tissue. Solid tissue should be broken by mechanical or enzymatic method. This takes time and may damage some cells.
- The fluidic channel and nozzle are narrow. Cell clumps, protein precipitate or large cells may block the system. So sample filtration is needed before running. Cells should be small enough for smooth flow.
- The instrument is costly. Fluorescent antibodies and reagents are also expensive. Regular calibration is needed. Proper cleaning is also required to prevent error and sample carryover.
- It needs trained person for operation. Multi-colour panel designing is not simple. Wrong antibody combination may give poor result. Data analysis also needs experience.
- Fluorescent dyes may show spectral overlap. One dye can give signal in another detector. This is called spillover. So compensation is required. If compensation is wrong, result becomes incorrect.
- In conventional flow cytometry, number of markers is limited. Because many fluorochromes overlap with each other. Usually only limited number of markers can be used together. Very complex panel becomes difficult.
- There is risk of contamination and biohazard. Some instruments cannot be kept inside normal biosafety cabinet. Fluidics system is not single use. Aerosol may be produced during sorting of infectious sample.
- False data may occur due to doublets. Doublets are two or more cells passing together through laser. Cellular debris may also be counted as events. So proper gating is needed to select only single viable cells.
- Rare cell detection may take longer time. Very large number of cells may need to be acquired. Sometimes target cells are very few in the sample. In such case, pre-enrichment like magnetic separation may be required.
- Cell viability may decrease during processing. Long staining, centrifugation or tissue digestion may stress the cells. Dead cells can bind antibody non-specifically. This may give false positive result.
Clinical and Research Significance of Flow Cytometry
Flow cytometry has important use in clinical diagnosis and research work. It can identify cell type, count cell population and study cell function. It is used in blood disease, immune monitoring, cancer study and cell biology.
A. Clinical significance
- Diagnosis of blood cancers
Flow cytometry is used for diagnosis and classification of blood cancers. It is useful in acute and chronic leukemia. It is also used in lymphoma and plasma cell neoplasm like multiple myeloma. Abnormal cells are identified by their surface and intracellular markers. - Detection of MRD
It is used to detect minimal residual disease (MRD) after treatment. Very small number of leukemic cells can be detected in bone marrow. It may detect about 0.1 to 0.001% abnormal cells. This helps to know remission and risk of relapse. - Diagnosis of blood and immune disorders
It is used in non-cancer blood and immune diseases also. Paroxysmal nocturnal hemoglobinuria (PNH) can be diagnosed. Myelodysplastic syndromes (MDS) and common variable immunodeficiency can also be studied. Some coagulation related defects like antithrombin deficiency may also be evaluated. - Monitoring of HIV/AIDS
CD4+ T lymphocyte count is measured by flow cytometry. It is done in peripheral blood. It helps to know immune status in HIV/AIDS patient. It also helps to check response to antiretroviral therapy. - Autoimmune and rheumatology use
HLA-B27 expression on T lymphocytes can be tested. It is useful in suspected ankylosing spondylitis. This helps in screening and diagnosis along with clinical findings. - Maternal-fetal and transfusion use
Flow cytometry is used to detect and measure fetal hemoglobin. This helps in proper dose of anti-D immunoglobulin in pregnant patient. It is also used in ABO blood group discrepancy and quality control of stored blood components. - Solid tumor prognosis
It can measure DNA ploidy and S-phase fraction in tumor cells. These are used as prognostic markers. It may be used in carcinomas like breast cancer and cervical cancer.
B. Research significance
- Immune profiling
Flow cytometry is used for detailed immune cell profiling. Many markers can be studied together. It helps to study tumor microenvironment (TME). It is also used in immunotherapy trials. - Cell sorting
FACS is used to sort selected living cells. Specific target cells are separated in pure form. These cells are used for culture, gene expression study and other biological experiments. - Cell cycle study
Fluorescent DNA-binding dyes are used for cell cycle analysis. Cells in different phases of replication can be measured. Cell doubling time and abnormal DNA content can be studied. - Aneuploidy detection
Flow cytometry can identify abnormal chromosome content indirectly by DNA measurement. Aneuploidy and chromosomal abnormality can be studied. This is useful in cancer research. - Apoptosis and necrosis study
It is used to study cell death. Apoptosis and necrosis can be separated by different dyes and markers. It detects morphological and biochemical changes in dying cells. - Cell proliferation study
Cell division can be followed by fluorescent membrane dyes. These dyes become diluted after each division. This helps to study proliferation after cytokine or growth factor stimulation. - Functional assay
Flow cytometry is used to measure cell response to stimuli. Intracellular calcium flux, metabolic activity and signal transduction can be studied. Protein phosphorylation can also be detected. - Molecular biology use
It can detect RNA, mRNA and miRNA in cells. Protein expression can be measured. Post-translational changes like phosphorylation are also studied. - Environmental microbiology
Flow cytometry is used outside medical field also. It is used in marine biology and ecology. Photosynthetic picoplankton and microbial populations in water, soil and sediment can be analysed.
References
- 1 INTRODUCTION Flow Cytometry involves the use of a beam of laser light projected through a liquid stream that contains cells, o. (n.d.).
- Accurate identification of cell doublet profiles: Comparison of light scattering with fluorescence measurement techniques. (n.d.). PubMed.
- Strelkov, D., Davis, G., Quigley, D., Shaffer, P., & Kaduchak, G. (n.d.). Acoustic assisted hydrodynamic focusing for high-resolution imaging in conventional flow cytometers. Thermo Fisher Scientific.
- Seattle Children’s Hospital. (2026). Applications of flow cytometry.
- Nolla, H. (n.d.). Basic principles in flow cytometry. CRL Flow Cytometry Lab, University of California, Berkeley.
- Maciorowski, Z. (n.d.). Basics of sorting. Curie Institute, Paris, France.
- Wikipedia. (2026, May 15). Cell sorting. In Wikipedia. https://en.wikipedia.org/w/index.php?title=Cell_sorting&oldid=1354267241
- STEMCELL Technologies. (n.d.). Considerations for flow cytometry gating | FACS analysis.
- KCAS Bio. (n.d.). CyTOF vs spectral flow cytometry: Overview and comparison.
- Iyer, A. I., Hamers, A. A. J., & Pillai, A. B. (2022). CyTOF® for the masses. Frontiers in Immunology, 13, 815828. https://doi.org/10.3389/fimmu.2022.815828
- Bardina, J., Rico, L. G., Bistué-Rovira, À., Ward, M. D., Bradford, J. A., & Petriz, J. (n.d.). Differently cell doublet profiles: Comparison of light scattering with fluorescence measurement techniques. Thermo Fisher Scientific.
- UWCCC Flow Cytometry Laboratory. (2014, October 24). Doublet discrimination. University of Wisconsin Carbone Cancer Center.
- Bio-Rad Antibodies. (n.d.). Electrostatic cell sorting: How it works | Flow cytometry guide.
- Essential fluidics for a flow cytometer. (n.d.). PubMed Central (PMC).
- Riaz, Z. (2024, November 5). Excluding doublets in FACS analysis: A comprehensive guide. Assay Genie.
- McGovern Medical School. (n.d.). FMO controls. UTHealth Houston.
- Kala, P. S., & Zubair, M. (2024, September 11). Flow cytometry blood cell identification. In StatPearls. StatPearls Publishing. https://www.ncbi.nlm.nih.gov/books/NBK608011/
- BD Biosciences. (n.d.). Flow cytometry controls – tips for better data.
- Belmont, M. (n.d.). Flow cytometry gating for beginners. Proteintech Group.
- Bio-Rad Antibodies. (n.d.). Flow cytometry guide: Doublet discrimination.
- Department of Laboratory Medicine & Pathology, UW Medicine. (n.d.). Flow cytometry hematopoietic disorders | Laboratory test guide. University of Washington.
- Flow cytometry – A basic overview. (n.d.).
- Pandey, A. (n.d.). Flow cytometry: Test, principles, uses & diagnostic applications. Agile Bioanalytical Services CRO.
- Cleveland Clinic. (2024, August 1). Flow cytometry: Test, uses, & results.
- Srinivasan, R. (n.d.). Flow vs. spectral vs. mass cytometry: What’s the difference? Teiko.
- Thermo Fisher Scientific. (n.d.). Fluidics of a flow cytometer.
- Abcam. (n.d.). Fluorescence minus one (FMO) controls: A key step in flow cytometry panel validation.
- Bio-Rad Laboratories. (n.d.). Fluorescence-activated cell sorting (FACS).
- High-dimensional single-cell analysis: Principles, methodologies, and clinical applications of advanced cytometry. (n.d.).
- CYM. (n.d.). Hydrodynamic focusing. Cytometry.
- Chen, A. (2025, May 20). Hydrodynamic focusing in flow cytometry. Bitesize Bio.
- School of Biomedical Sciences. (n.d.). Introduction to flow cytometry. The University of Melbourne.
- Biocompare. (n.d.). Mass cytometry vs flow cytometry.
- Matrix recovery algorithm for reconstructing mixing matrices from raw observations and ordinary least squares unmixed abundance values. (n.d.). PubMed.
- Principles of the flow cytometer. (n.d.). Moodle@Units.
- Spectral flow cytometry: The current state and future of the … (n.d.). PubMed Central (PMC).
- Understanding traditional compensation and spectral unmixing processes. (n.d.). Fred Hutch ExtraNet.
- Unlocking insights: The vital role of unmixing algorithms in spectral flow cytometry. (n.d.). Beckman Coulter Life Sciences.
- Unmixing spread estimation based on residual model in spectral flow cytometry. (n.d.). bioRxiv.