

What Is Epidemiology?
Epidemiology is the study of health and disease in populations. It studies who is affected, where and when the health problem occurs, and the factors related with its occurrence.
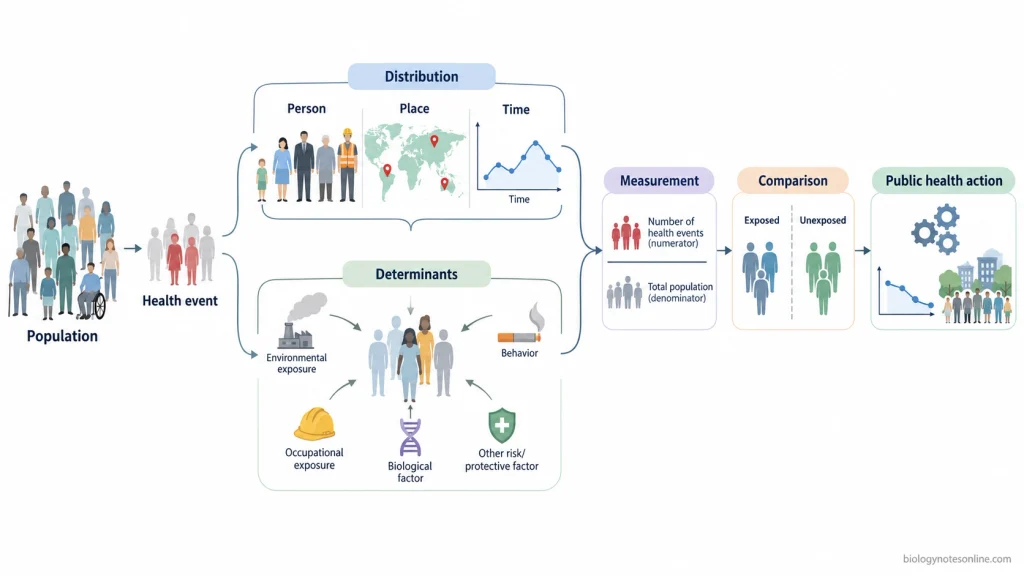
In scientific terms, epidemiology is the study of the distribution and determinants of health-related states or events in specified populations. The information obtained from this study is applied for the prevention and control of health problems.
Epidemiology is not only the study of epidemics or infectious diseases. Disease is one part of epidemiology. Injuries, health behaviors, exposures, use of health services, and other health outcomes can also be studied.
Earlier epidemiological works were strongly associated with infectious diseases. The field now includes a much wider range of health conditions and events.
For the “epidemiology meaning” or “definition of epidemiology”, there is no actual one-word synonym that gives its complete scientific meaning. Terms such as “population health” are related terms, but they are not exact replacement for epidemiology.
Epidemiology in simple terms
In simple terms, epidemiology is used to find out how often a health problem occurs in a group of people, who are affected, and why the problem may occur.
It deals with patterns occurring in a population rather than studying only one sick person. For example, an epidemiologist may study whether a disease occurs more frequently in a particular age group, place, season, occupation, or among people having a particular exposure.
Key parts of the formal definition
The following are the major parts included in the formal definition of epidemiology-
Distribution- Distribution describes the frequency and pattern of a health-related event. The pattern is studied according to person, place, and time. Frequency tells how much or how often the event occurs in the population.
Determinants- These are factors that influence the occurrence of a health state or event. Causes, risk factors, environmental exposures, behaviors, and other conditions may act as determinants. Epidemiological studies are used to examine their relationship with different health outcomes.
Health-related states or events- Epidemiology is not confined to any particular infectious disease. Disease, behavior, drug use, health-service utilization, and different health outcomes can come under epidemiological study.
Specified populations- Epidemiological study is carried out in a defined group or population. It may include people living in a town, patients attending a hospital, people having a particular disease, an occupational group, or another population selected for the study.
Application to prevention and control- Epidemiological information is used in public health practice. The identified patterns and determinants can be applied for planning preventive measures, controlling health problems, and evaluating health interventions.
Why it is called epidemiology
Derived from the Greek words epi meaning “upon”, demos meaning “people”, and logos meaning “study”.
The word epidemiology can literally be understood as the “study of what is upon the people”. Its modern scientific use includes much more than the study of epidemics alone.
Epidemiology vs individual clinical medicine
The major unit of concern in epidemiology is the population or community. Individuals are studied collectively for understanding the occurrence, distribution, and determinants of health-related events.
In clinical medicine, the primary concern is generally the individual patient. Diagnosis, prognosis, and treatment are directed toward that particular person.
Core Principles of Epidemiology
Epidemiology is based on studying health-related states or events in a population by measuring their occurrence, distribution and the factors associated with them. Population is the main unit of concern. A defined population is required because the number of cases has little epidemiological meaning unless it is related with the population from which those cases arise.
One of the basic principles is quantification of disease occurrence. Epidemiologists count health events and express them as proportions, risks or rates so that populations can be compared. Prevalence describes existing cases of a condition in a population, while incidence deals with new cases occurring during a specified period. Incidence rate can also take into account the person-time for which individuals remain at risk.
The distribution is studied according to person, place and time. Person includes characteristics of the affected population, while place deals with geographical or other location-related differences. Time may show short-term changes, seasonal patterns or trends occurring over longer periods. This descriptive approach is used to pick up unusual patterns and groups having higher or lower occurrence of a health event.
Comparison is another important principle. Epidemiology commonly compares groups having different exposures, characteristics or health outcomes. An exposed population may be compared with an unexposed population, cases with controls, or disease occurrence between two or more populations. Measures such as relative risk and odds ratio are then used to describe the strength of an observed association, depending on the type of study design.
Epidemiology also searches for determinants. These may be biological, behavioral, environmental or other factors related with occurrence of a health state. An association, however, does not itself mean that one factor causes the other. Chance, bias and confounding can produce or alter an observed relationship, and these are considered before making causal interpretations. Many diseases also have multiple contributing causes rather than one single cause.
The research question determines the epidemiological study design. Descriptive epidemiology mainly describes what occurs, in whom, where and when. Analytical epidemiology goes further and examines relationships between exposures and outcomes, generally using comparison groups to test a hypothesis. Epidemiological studies may be observational or experimental, and each design has its own strengths and limitations.
Accuracy of measurement is important. Selection of study participants, measurement of exposure and outcome, sample size and other parts of the study can affect the result. Selection bias, information bias and confounding are important sources of systematic error, while random error may occur because only a sample of the population is studied. These factors are considered during study design, analysis and interpretation of epidemiological data.
Epidemiological information is applied to public health problems. Disease occurrence can be monitored by surveillance, changes in incidence can be detected, and populations at greater risk can be identified. The collected evidence is used in planning prevention and control measures, allocation of public health resources and evaluation of interventions.


Objectives of Epidemiology
The following are the major objectives of epidemiology:
- To identify causes and risk factors- Epidemiology is used to identify the factors associated with the occurrence of a disease or other health condition. These may include biological, environmental, behavioral or other exposures that increase or decrease the risk of disease.
- Determination of disease extent- It measures how much disease or a health-related event is present in a community. Its distribution among different persons, places and over time is also studied, giving information about the groups in which the health problem occurs more frequently.
- To study natural history and prognosis- Epidemiology follows the course of disease from its occurrence and progression to different possible outcomes. Changes occurring with time, duration of disease and prognosis can be studied in populations.
- Evaluation of preventive and therapeutic measures- Preventive measures, treatments and different modes of health-care delivery can be evaluated epidemiologically. It is used to find out how these measures perform when applied to individuals or populations.
- To provide a basis for public health planning and policy- Epidemiological data are used in developing public health policies, regulations and disease-control programs. Information on disease burden and risk factors also helps in planning preventive measures and deciding where public health action is required.
Scope and Applications of Epidemiology
The scope of epidemiology is very wide and is not limited only to epidemics or infectious diseases. It covers infectious diseases, chronic diseases, injuries, environmental and occupational exposures, health behaviors, clinical outcomes, health services and other health-related states or events occurring in populations. Epidemiological methods are also applied in clinical medicine, social and genetic studies, risk assessment and public health practice.
- Measurement of disease burden- Epidemiology is used to measure the occurrence of disease, disability, injury and death in a population. Incidence, prevalence and mortality data can show the magnitude of a health problem and its changes with time.
- Disease surveillance- Health events and population risk factors are monitored continuously or repeatedly. Surveillance can pick up changes in disease occurrence, emerging health problems and unusual increases in cases.
- Investigation of outbreaks- Epidemiological methods are used to find out the source, mode of transmission and populations at risk during an outbreak. The distribution of cases according to person, place and time is studied, which helps in selecting measures for control.
- Identification of causes and risk factors- One of the major applications is searching for the determinants of disease. Biological, behavioral, environmental, social and genetic factors can be studied for their association with a particular health outcome. Cohort and case-control studies are commonly used for this purpose.
- Study of natural history and prognosis- Epidemiology is used to study how a disease develops and progresses in populations. Outcomes of illness, prognosis, survival and other changes during the course of disease can also be examined.
- Prevention and control of diseases- Epidemiological findings are applied to select and evaluate preventive measures. Vaccination and other population interventions can be studied by observational as well as intervention studies.
- Screening and diagnosis- Epidemiological principles are used in evaluation of diagnostic tests and screening programs. Measures of test performance and the effects of screening are studied before their wider application in a population or clinical setting.
- Evaluation of treatment and health interventions- Treatments, vaccines, medical devices and public health interventions can be evaluated for their outcomes, benefits and possible adverse effects. Epidemiological data are also used for drug-safety surveillance after a drug comes into wider clinical use.
- Clinical epidemiology- Population-based epidemiological methods are applied to clinical problems. They are used for studying prognosis, treatment outcomes, diagnosis, screening and clinical decision-making.
- Health services and program evaluation- Epidemiology is used to examine the use, performance and outcomes of health-care services and programs. Patterns of care, health-care costs, service needs and gaps in health-care delivery may also be studied.
- Environmental, occupational and social epidemiology- The effects of environmental exposures, workplace factors and social conditions on human health are studied by epidemiological methods. The same approach can be used for genetic factors and their relation with health outcomes.
- Public health planning and policy- Information on disease trends, risk factors, population needs and effects of interventions is used in planning health programs and allocation of resources. Epidemiological findings can also provide evidence for public health and health-care policy decisions.
Major Approaches in Epidemiology
The major approaches of epidemiology are descriptive, analytical and experimental epidemiology. These approaches differ mainly in whether a health event is being described, an association is being examined, or an intervention is deliberately introduced by the investigator.
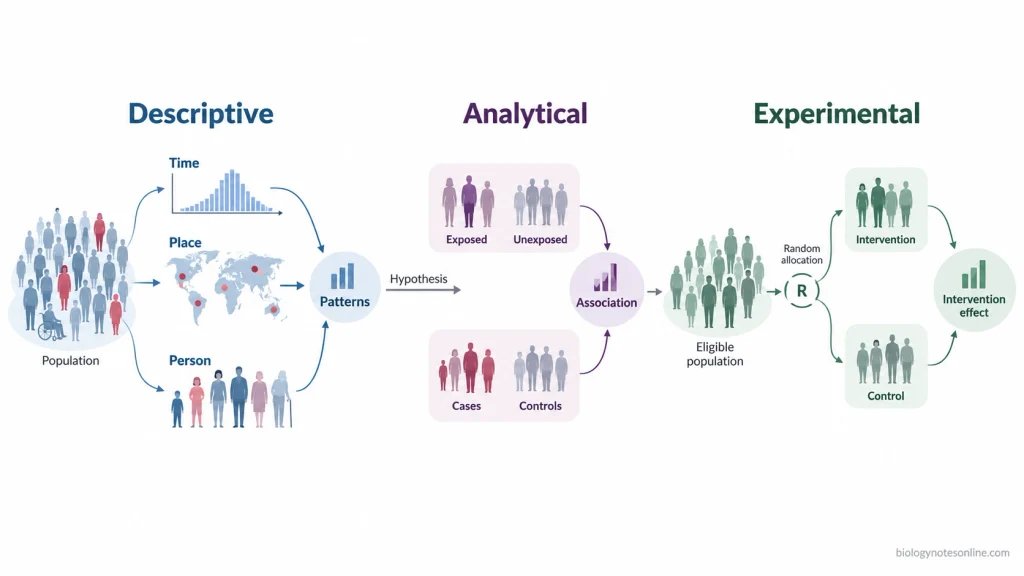
- Descriptive epidemiology- It is concerned with describing the occurrence and distribution of disease or other health-related events in a population. The data are generally arranged according to person, place and time. It tells who is affected, where the cases occur and when the health event occurs. Disease surveillance, case reports and case series can provide descriptive epidemiological information. Descriptive studies are commonly used to pick up patterns and generate a possible hypothesis, rather than formally testing a causal hypothesis.
- Analytical epidemiology- Analytical epidemiology is used to examine an association between an exposure and a health outcome. Comparison is important here. People having a particular exposure may be compared with those without the exposure, or persons having a disease (cases) with suitable controls. Cohort and case-control studies are two major analytical study designs, and cross-sectional studies may also be used for analytical questions. It is used for testing epidemiological hypotheses and measuring the association of suspected risk factors with disease.
- Experimental or interventional epidemiology- In this approach, the investigator deliberately assigns an intervention or exposure and observes its effect on the health outcome. A control or comparison group is generally included. In a randomized controlled trial (RCT), participants are randomly assigned to the study groups, which helps in reducing differences between the groups and confounding. Experimental epidemiology is commonly used for studying preventive or therapeutic interventions, such as drugs, treatments or other health interventions.
Epidemiologic Study Designs
Epidemiologic approaches and epidemiologic study designs are related, but they are not the same thing. Descriptive, analytical and experimental epidemiology indicate the broad purpose or approach of investigation.
A study design is the actual framework used for selecting subjects, measuring exposure and outcome, making comparisons and collecting the data. For example, a cross-sectional study can be descriptive when only prevalence is measured, or analytical when exposure and outcome groups are compared. Epidemiological study designs are broadly divided into observational studies and interventional (experimental) studies.
In observational studies, the investigator does not assign the exposure. In an interventional study, an intervention is introduced or assigned by the investigator.
Cross-sectional studies
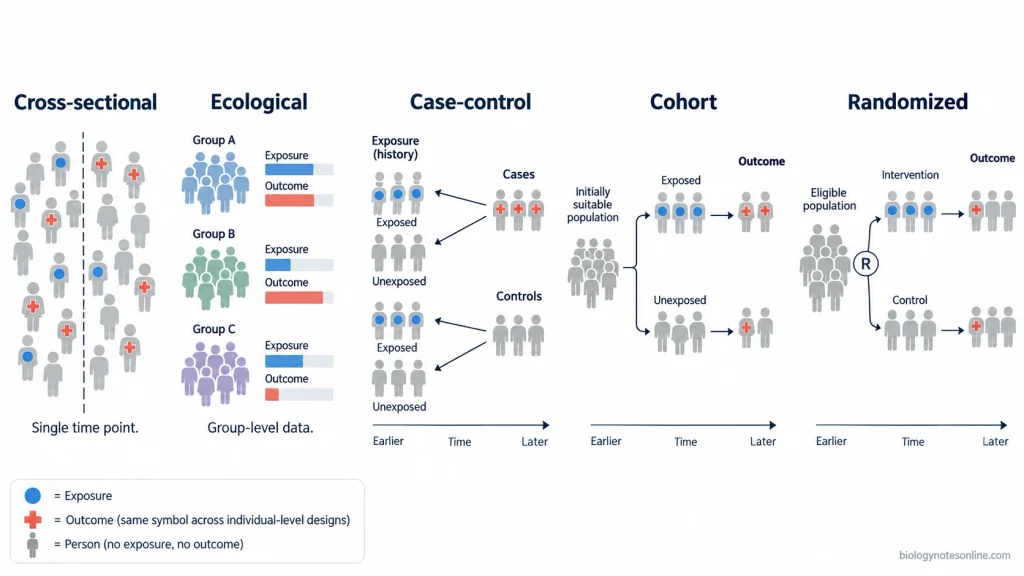
A cross-sectional study examines a population or sample at a particular point or short period of time. Exposure and outcome are measured at about the same time. It gives a “snapshot” of the population.
These studies are commonly used for measuring prevalence of disease, health conditions, behaviors or exposures. Exposure groups may also be compared, making the study analytical. Prevalence ratio, prevalence difference and prevalence odds ratio are some measures that can be obtained depending on analysis. They are relatively quick and usually require no long follow-up.
The major problem is temporality. Since exposure and outcome are measured together, it may not be possible to establish whether the exposure occurred before the disease.
Ecological studies
In an ecological study, the unit being studied is a group or population, rather than a separate individual. Groups may be countries, cities, schools, occupational groups or populations observed during different time periods. Exposure and disease information are compared at this group level.
It is useful when population-level data are already available and can be used to study geographical or temporal differences. Disease rates, prevalence, mortality rates and other aggregated measures may be compared between groups.
A major limitation is the ecological fallacy. An association found between two variables at population level does not necessarily mean that the same association exists among individuals within those populations.
Case-control studies
Case-control study starts with the outcome. Individuals having a disease or another outcome are selected as cases, while persons without that outcome are selected as controls. Their previous exposures are then compared.
The direction of inquiry is usually from outcome to past exposure. Case-control studies are particularly useful for rare diseases and diseases having a long period between exposure and development of the outcome. They can examine several possible exposures for one outcome without following a very large population for many years.
The main measure of association is the odds ratio (OR). Disease incidence or absolute risk usually cannot be calculated directly from a traditional case-control study because participants are selected according to their outcome status. Selection of suitable controls is very important. Recall bias and selection bias can become major problems.
Cohort studies
A cohort study generally begins with people classified according to an exposure and follows or traces them for occurrence of the outcome. The direction is mainly exposure to outcome.
Cohort studies may be prospective or retrospective (historical). In a prospective cohort, exposure is determined first and participants are followed forward in time. A retrospective cohort uses previously recorded information to reconstruct the exposure and subsequent outcomes, but the cohort is still defined from the exposure side rather than by selecting cases and controls.
Incidence can be measured directly. Relative risk (risk ratio), incidence rate ratio, risk difference and hazard ratio can also be estimated where appropriate. One exposure can be studied in relation with several different outcomes.
Cohort studies establish the temporal sequence between measured exposure and subsequent outcome more clearly than a cross-sectional design. Prospective cohorts, however, can take a long time and require considerable resources. Loss to follow-up is another problem, and ordinary cohort studies are inefficient when the outcome is very rare.
Randomized and other interventional studies
In an interventional study, the researcher introduces an intervention and observes what happens after it. The randomized controlled trial (RCT) is an important experimental design. Participants are allocated randomly to intervention and comparison groups, which helps to balance measured and unmeasured prognostic factors between groups on average when randomization is successfully performed.
The intervention may be a treatment, vaccine, preventive measure or another planned health intervention. Outcomes are then compared between groups. Incidence, risk ratio, rate ratio, risk difference and other measures can be calculated depending on the outcome and study.
Not every intervention study must randomize individuals. Cluster randomized trials may assign whole groups, while some interventions are evaluated using non-randomized or before-and-after designs. Randomization may also be impossible or unethical, particularly when the exposure being tested is suspected to cause harm.
Comparison of major epidemiologic study designs
| Study design | Starting point | Basic direction of inquiry | Typical use | Suitable measures | Major strength | Major limitation |
|---|---|---|---|---|---|---|
| Cross-sectional | A population or sample at one defined time | Exposure and outcome measured together | Prevalence, population characteristics, exposure-outcome associations | Prevalence, prevalence ratio, prevalence odds ratio, prevalence difference | Quick and can study several exposures and outcomes | Exposure-outcome temporality is often uncertain. |
| Ecological | Groups or populations | Group exposure compared with group outcome | Population differences, geographical and time patterns, hypothesis generation | Population rates, prevalence, rate or prevalence comparisons, correlations | Can use large existing population datasets | Group-level association may not apply to individuals (ecological fallacy). |
| Case-control | Cases with an outcome and controls without it | Outcome → previous exposure | Rare disease, long-latency outcomes and study of multiple exposures | Odds ratio (OR) | Efficient for rare outcomes | Direct incidence usually cannot be obtained. Selection and recall bias may occur. |
| Cohort | People classified according to exposure | Exposure → outcome | Incidence, risk factors, prognosis and multiple outcomes | Incidence, risk ratio, rate ratio, risk difference, hazard ratio | Temporal sequence can be established and incidence measured directly | Prospective studies may be lengthy and expensive, with loss to follow-up. |
| Randomized/interventional | Eligible individuals or groups assigned an intervention | Intervention → outcome | Effects of preventive or therapeutic interventions | Risk, incidence, risk ratio, risk difference and other effect measures | Randomization reduces confounding between comparison groups on average | Ethics, cost and practical feasibility can prevent randomization. |
Choosing a study design
There is no single study design suitable for every epidemiological question. Selection is based first on what is actually being asked and also on the disease, exposure, available population and practical conditions of the study.
Research question- The research question comes first. A question about prevalence may be answered using a cross-sectional design, whereas an exposure-disease relationship requiring incidence and follow-up may need a cohort study. Questions about an intervention may require an experimental design where it is possible.
Temporality- When it is necessary to establish that exposure was present before development of the outcome, a longitudinal design is preferred. Cohort studies provide this temporal sequence more directly. Cross-sectional studies usually cannot do this because both are measured together.
Frequency of the outcome- Rare outcomes are difficult to study by following a large general population until enough cases develop. A case-control study can be much more practical in such situations. Cohort designs become useful when the exposure itself is uncommon but an exposed population can be identified.
Feasibility- Availability of participants, records, exposure information and adequate follow-up must be considered. A theoretically strong design may not be workable when required data cannot be obtained.
Ethics- Harmful or potentially harmful exposures cannot simply be assigned to people for experimental purposes. Such questions are generally studied by observational methods. Epidemiological investigations involving human participants are also required to consider informed consent, risks and protection of the study population.
Resources- Money, time, staff, study population, data sources and duration of follow-up affect selection of the design. Prospective cohort studies and large randomized trials can need extensive resources, while cross-sectional or case-control studies can often be conducted with less time for suitable research questions.
Measures Used in Epidemiology
Measures in epidemiology are quantitative tools used to describe the occurrence of health events and compare their occurrence between populations or exposure groups. There is no single accepted set known as the “four measures of epidemiology”. Count, proportion, ratio and rate are basic numerical forms used in epidemiological calculations. The epidemiological measures themselves are commonly grouped into measures of frequency, measures of association and measures of impact.
Basic quantitative measures
- Count- It is simply the number of persons or events fulfilling a particular definition. For example, the number of cases of a disease reported in a population. A count does not consider the size of population from which those cases came.
- Proportion- A proportion is a fraction in which the numerator forms part of the denominator. It ranges from 0 to 1 and is commonly expressed as a percentage. Prevalence and incidence proportion are examples.
- Ratio- It compares one quantity with another quantity. The numerator does not necessarily form a part of the denominator. Ratios are widely used while comparing disease occurrence between two groups.
- Rate- Rate measures the occurrence of an event with a component of time. In a true incidence rate, the denominator consists of person-time at risk, such as person-years or person-months.
Measures of frequency
These measures show how much disease or another health-related event is present or develops in a population. Incidence and prevalence are the two important disease-frequency measures.
- Prevalence- It measures existing cases of a disease at a specified point or during a particular period.Prevalence = Existing cases / Population examinedIt is mainly a measure of disease burden. Both new and previously existing cases can be present in the numerator.
- Incidence proportion (cumulative incidence or risk)- This measures the proportion of an initially disease-free population that develops the disease during a specified period.Incidence proportion = New cases during a period / Population at risk at the beginningIt gives the probability or risk of developing the outcome over that defined period.
- Incidence rate (incidence density)- Incidence rate uses new cases, but person-time is used in the denominator.Incidence rate = New cases / Total person-time at riskIndividuals can contribute different lengths of observation time. This makes incidence rate useful when follow-up time is not equal for everyone.
- Other frequency measures- Mortality measures are used for deaths occurring in populations. An attack rate is essentially a cumulative incidence commonly used during outbreaks, while case-fatality describes the proportion of persons with a particular disease who die from it. Different age-specific, cause-specific and population-specific measures can also be calculated.

Measures of association
Measures of association compare the frequency of an outcome between groups, commonly an exposed group and an unexposed group. They indicate the numerical relationship between an exposure and health outcome.
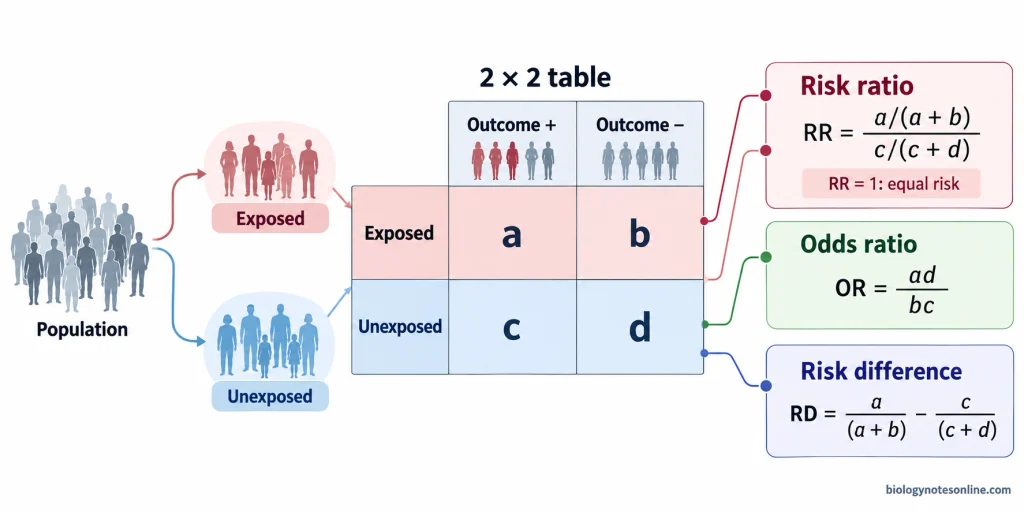
- Risk ratio (Relative Risk, RR)- It compares the risk of disease in exposed persons with the risk among unexposed persons.RR = Risk in exposed / Risk in unexposedRR = 1 indicates equal risks in the two groups. Values above or below 1 indicate higher or lower risk in the exposed group, although the observed association by itself does not establish causation.
- Rate ratio- It compares two incidence rates instead of two incidence proportions.Rate ratio = Incidence rate in exposed / Incidence rate in unexposedPerson-time is involved in the calculation of each incidence rate.
- Odds ratio (OR)- Odds ratio compares the odds between two groups. It is especially used in case-control studies, where disease risks usually cannot be calculated directly from the sampled cases and controls. For a standard 2 × 2 table, OR can be calculated as ad/bc.
- Prevalence ratio- It compares prevalence in one group with prevalence in another group. This measure can be used in cross-sectional studies when the outcome being compared is prevalence.
- Risk difference (RD)- This is an absolute measure.RD = Risk in exposed − Risk in unexposedIt gives the excess absolute risk associated with the exposure rather than expressing it as a ratio. Risk difference is a measure of association, but it is also useful when considering the possible impact of an exposure on disease occurrence.
Measures of impact
Impact measures estimate how much of the occurrence of a disease may be related to a particular exposure. Their interpretation as preventable disease requires a causal relationship between the exposure and outcome, along with the assumptions used for the estimate.
- Attributable fraction among exposed- It estimates the proportion of disease among exposed persons that is attributable to the exposure, under a causal interpretation.Attributable fraction among exposed = (Risk in exposed − Risk in unexposed) / Risk in exposedWhen expressed from the risk ratio, it can be written as (RR − 1) / RR.
- Population attributable fraction (PAF)- This measure considers the whole population, including exposed and unexposed persons. It estimates the fraction of disease occurrence in that population that could potentially be avoided if a causal exposure were removed, under the required assumptions.PAF = (Risk in total population − Risk in unexposed) / Risk in total populationThe value depends both on the strength of the exposure-disease relationship and on how common the exposure is in the population.
How Epidemiology Works in Practice
Epidemiology works through an organized process of defining the health problem, collecting population data, measuring its occurrence, finding the patterns, testing possible determinants, and applying the findings for prevention or control.
It is not a single fixed procedure that is followed for every health problem. The methods used depend on whether epidemiologists are routinely monitoring a disease, studying a risk factor, evaluating an intervention, or investigating an unusual increase in cases.
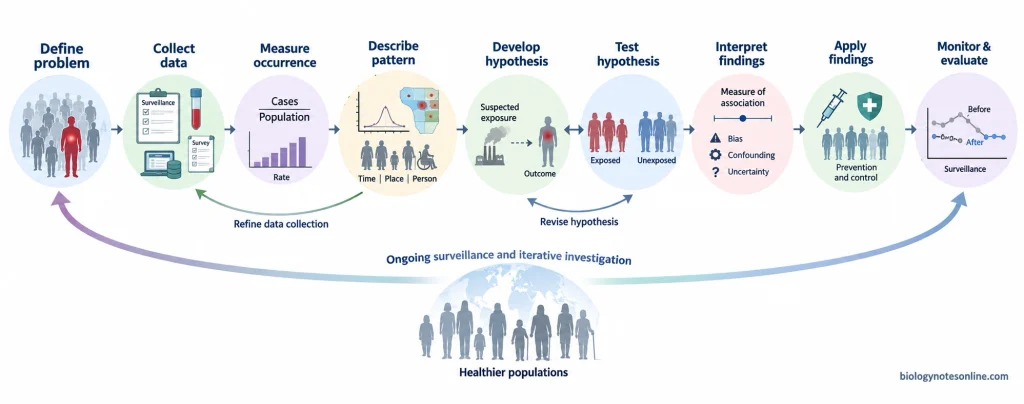
1. Define the health problem and population
The first step is to decide exactly what is to be studied. It may be a disease, injury, exposure, behavior, or another health-related event.
The population and the period of interest are also selected. When required, a clear outcome or “case” definition is used so that the persons or events are identified in a consistent manner.
2. Collect the epidemiological data
In this step, epidemiological information is collected from suitable sources. Medical records, laboratories, disease reports, registries, surveys, interviews, and other population data can be used. The source depends on the question being studied.
For diseases and other conditions that require regular tracking, public health surveillance is used. It involves the ongoing systematic collection, analysis, and interpretation of health data. The information is then passed to the persons responsible for public health action.
Surveillance may be passive or active. In passive surveillance, reports come from health-care or other reporting sources. In active surveillance, cases are specifically searched for.
3. Measure disease occurrence
The collected number of cases alone does not provide the complete picture. Epidemiologists relate these cases with the population from which they occur.
Counts, prevalence, incidence, incidence rates, mortality, and other appropriate measures are calculated. Person-time may be used when the individuals are followed for unequal periods.
4. Describe the pattern
The health-related event is commonly studied according to person, place, and time.
Person characteristics may include age, sex, occupation, or other characteristics. Place can show geographical differences. Changes according to time may reveal seasonal variation, long-term trends, or an unusual rise in the number of cases.
Tables, rates, graphs, and maps are some of the basic tools used for arranging and studying these data. During disease tracking, repeated surveillance data provide information about the expected level of a condition. An unusual change can then be picked up more easily.
5. Develop possible explanations
Patterns obtained from descriptive epidemiology may point towards certain exposures, behaviors, environmental conditions, or other determinants.
A hypothesis can then be formed to explain why one population has more disease than another. At this stage, the observed pattern is only a clue. It does not itself prove that a particular exposure has caused the outcome.
6. Test the hypothesis
Analytical methods are used when the possible relationship between an exposure and an outcome needs to be examined further. Comparison groups are important during this process.
Depending on the research question, cohort, case-control, cross-sectional, or other suitable study designs may be used. Randomized or other intervention studies are applied where an intervention can appropriately be assigned.
Measures such as risk ratios, rate ratios, odds ratios, or risk differences are then used for comparison.
7. Analyze and interpret the findings
Epidemiologists examine whether the groups differ and how large the observed association is. But the obtained number is not interpreted alone.
Chance, bias, and confounding, study design, measurement problems, and the temporal relationship between exposure and outcome are considered during interpretation. A statistical association does not automatically establish causation.
8. Apply the findings
Epidemiological findings are used in public health work. The information may be used for targeting preventive measures, selecting populations that need attention, planning health programs, allocating resources, or changing an existing control measure.
Surveillance information is especially useful when it reaches the decision-makers in time for public health action.
9. Monitor and evaluate
Tracking generally continues after a prevention or control measure has been introduced. Changes in incidence, prevalence, mortality, or other selected indicators can be followed.
During this process, surveillance is also used to examine whether an intervention is producing its intended population effect and to detect further changes in the health problem.
Examples of Epidemiology in Practice
Epidemiology can be applied to an outbreak, a chronic disease, evaluation of a vaccine, or finding whether an exposure is related with a health outcome. Some epidemiological examples became famous because they also show how population data can be converted into prevention measures.
John Snow and cholera
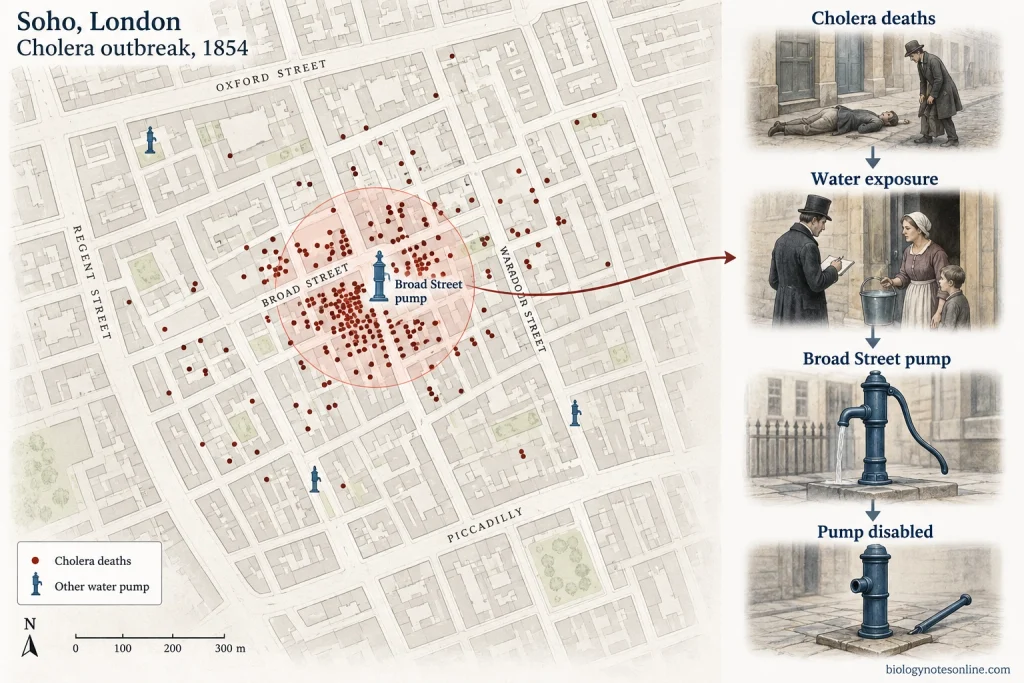
The investigation of John Snow during the 1854 cholera outbreak in Soho, London is one of the classic examples of epidemiology. Snow examined where cholera deaths occurred and found a marked concentration around the Broad Street water pump. Mapping was one part of the investigation. He also investigated the source of drinking water and compared cholera occurrence among populations supplied by different water sources. These observations supported his argument that cholera was being transmitted through contaminated water rather than “bad air”.
The Broad Street pump handle was subsequently removed, taking that suspected water source out of use. Snow’s work combined population comparison, geographical pattern, exposure investigation and preventive action, long before the causative bacterium was firmly established. He is widely described as the “father of modern epidemiology”, rather than simply the father of epidemiology.
Investigating an infectious-disease outbreak
Suppose an unusual number of diarrheal cases are reported from a village or institution. Epidemiologists first identify and search for cases using a defined case definition. The cases are then described according to person, place and time. An epidemic curve may show the time pattern, while a spot map can pick up geographical clustering.
Possible exposures are investigated from these patterns and interviews. For example, a common food item or water source may come up as a suspected exposure. A case-control or retrospective cohort study can then compare the suspected exposure among affected and unaffected persons. Laboratory and environmental findings may also be brought in. Control measures are selected from the evidence, such as stopping use of a contaminated source or controlling the identified route of transmission. This type of sequence has been used in actual cholera outbreak investigations.
Studying chronic-disease risk factors
Epidemiology is also used where disease develops slowly and no “outbreak” is present. The Framingham Heart Study, started in 1948, is a well-known example. It followed a community-based cohort over time to study the determinants and natural history of cardiovascular disease.
Participants were examined and followed for later cardiovascular outcomes. By comparing disease occurrence among persons with different characteristics, the study helped establish the importance of factors such as high blood pressure, elevated cholesterol, smoking, obesity, diabetes and physical inactivity in cardiovascular disease. This is cohort reasoning. Exposure or characteristics are recorded, people are followed, and later disease occurrence is compared between the groups.
A case-control approach can answer similar risk-factor questions from another direction. It starts with persons having the disease (cases) and persons without it (controls), then their previous exposures are compared.
Evaluating a vaccine or public-health intervention
Epidemiological methods are used to find whether a preventive intervention actually reduces disease. One historical example is the 1954 Salk poliomyelitis vaccine field trial. More than 600,000 schoolchildren received vaccine or placebo in the trial, with additional children included as observed controls. The study provided population evidence for evaluating the protective effect of the vaccine.
Evaluation does not stop after a vaccine enters routine use. Cohort and case-control studies can compare disease among vaccinated and unvaccinated persons under real-world conditions. Case-control studies, for example, compare previous vaccination among cases with vaccination among suitable controls. Surveillance data can also be used to examine changes in disease incidence after introduction of a vaccination program.
Worked epidemiology example
Consider a factory where workers from one production section appear to develop dermatitis more frequently.
Research question- Is regular exposure to a particular cleaning chemical associated with development of dermatitis among the factory workers?
Population- Workers employed in the factory during the selected study period.
Exposure- Regular occupational contact with the cleaning chemical. Workers can be classified as exposed and unexposed according to their work assignment and exposure information.
Outcome- New cases of dermatitis identified using the same case criteria in both groups.
Measure- The incidence proportion of dermatitis is calculated separately among exposed and unexposed workers.
Comparison- The two risks can be compared using a risk ratio (RR) or risk difference. If dermatitis occurs more frequently among exposed workers, an association between the chemical exposure and dermatitis is observed.
Interpretation- The association is examined with other possible explanations, including differences between the worker groups, measurement error, confounding and chance. A higher risk in the exposed group alone does not automatically establish that the chemical caused every case.
Action- If the total epidemiological and occupational evidence supports the exposure as harmful, exposure can be reduced through suitable workplace control measures and disease occurrence can be monitored after the intervention.
Limitations of Epidemiologic Evidence
Epidemiological studies provide evidence about the occurrence, distribution, and possible determinants of health outcomes. But the observed relationship may not always represent the true relationship exactly. Chance, bias, and confounding are some of the major problems considered during interpretation.
- Association does not always mean causation- An exposure may be associated with a disease without causing it. Chance, bias, confounding, or other explanations may produce the observed association. Temporal relationship and other evidence are also considered for causation.
- Random error- Epidemiological studies usually use a sample rather than the whole target population. Sampling variation may give an estimate different from the true value. Small sample sizes generally produce less precise estimates and wider confidence intervals.
- Selection bias- It occurs when selected study participants differ systematically in a way that affects the exposure-outcome relationship. Inappropriate controls or loss of different types of participants during follow-up can produce selection bias.
- Information bias and measurement error- Exposure, disease, or other variables may be measured incorrectly. Wrong classification is referred to as misclassification. Recall bias can also occur when cases and controls remember past exposures differently.
- Confounding- A third factor may mix up the relationship between exposure and outcome. Differences in age, smoking, socioeconomic status, or another determinant may make an association stronger, weaker, or apparently present. Unmeasured factors may produce residual confounding even after adjustment.
- Problems with temporality- A causal exposure must occur before the outcome. Some study designs cannot clearly establish this order. In cross-sectional studies, exposure and outcome are generally measured together, and reverse causation may occur.
- Limited control in observational studies- Most epidemiological studies do not assign exposures experimentally. Exposed and unexposed groups may differ in many other characteristics. Randomization is absent in ordinary observational epidemiology.
- Limited generalizability- Findings from one population may not equally apply to another population. Age, genetic background, environment, exposure level, health-care conditions, and other characteristics may differ. This is referred to as external validity.
- Multiple comparisons- Testing many exposures, outcomes, or statistical relationships may produce some unusual associations by chance alone. The number of analyses and whether the hypothesis was specified before analysis are considered.
- Statistical significance may have limited practical meaning- Statistical significance does not prove causation or a large effect. A large study may detect a very small association, while a small study may miss an important association because of low precision or statistical power.
Epidemiology at a Glance
| Topic | Quick exam summary |
|---|---|
| Definition | Epidemiology is the study of distribution and determinants of health-related states or events in specified populations, and application of this study for prevention and control of health problems. |
| Main focus | Population or community, rather than one individual patient. |
| Distribution | Describes who, where and when a health event occurs. Commonly studied as person, place and time. |
| Determinants | Factors associated with occurrence of disease or health events. These may be biological, environmental, behavioral, social or occupational. |
| Major objectives | To measure disease occurrence, identify causes and risk factors, study natural history and prognosis, evaluate interventions and provide evidence for public health planning. |
| Major approaches | Descriptive epidemiology describes disease patterns. Analytical epidemiology tests exposure-outcome relationships. Experimental epidemiology studies effects of assigned interventions. |
| Broad study-design groups | Observational studies and experimental/interventional studies. |
| Cross-sectional study | Exposure and outcome are measured at about the same time. Commonly used for prevalence. Temporality may be unclear. |
| Ecological study | The unit of study is a group or population, not an individual. Major limitation is ecological fallacy. |
| Case-control study | Starts with disease status: cases and controls → previous exposure. Useful for rare diseases. Major measure is odds ratio (OR). |
| Cohort study | Starts mainly with exposure → follows or traces development of outcome. Incidence and risk ratio (RR) can be calculated. |
| Randomized controlled trial (RCT) | Participants are randomly assigned to intervention and comparison groups. Used mainly for evaluation of preventive or therapeutic interventions. |
| Measures of frequency | Prevalence, incidence proportion, incidence rate, mortality and other measures of disease occurrence. |
| Prevalence | Existing cases in a population. Prevalence = Existing cases / Population examined |
| Incidence proportion | New cases developing among persons initially at risk during a specified period. New cases / Population at risk |
| Incidence rate | New cases divided by person-time at risk. |
| Measures of association | Compare disease occurrence between groups. Examples are risk ratio, rate ratio, odds ratio, prevalence ratio and risk difference. |
| Risk ratio (RR) | Risk in exposed / Risk in unexposed |
| Odds ratio (OR) | Common measure in case-control studies. For a 2 × 2 table, OR = ad/bc. |
| Risk difference (RD) | Risk in exposed − Risk in unexposed. Gives the absolute difference in risk. |
| Measures of impact | Include attributable fraction and population attributable fraction (PAF). Used to estimate disease occurrence related with an exposure under a causal interpretation. |
| Basic working process | Define problem → collect data → measure occurrence → study person/place/time → develop hypothesis → compare groups → interpret findings → apply control or prevention → monitor. |
| Disease tracking | Mainly done through public health surveillance, where health data are systematically collected, analyzed and interpreted over time. |
| Classic example | John Snow and the 1854 cholera outbreak. Geographic patterns and water-source comparisons were used to investigate transmission. Snow is widely referred to as the father of modern epidemiology. |
| Chronic-disease example | The Framingham Heart Study used cohort follow-up to study cardiovascular disease risk factors. |
| Main errors/limitations | Random error, selection bias, information bias, confounding, measurement error, loss to follow-up and limited generalizability. |
| Causation point | Association does not automatically mean causation. Temporality, bias, confounding, chance and other evidence must be considered. |
| Epidemiology vs clinical medicine | Epidemiology mainly deals with the population, while clinical medicine primarily deals with the individual patient. |
References
- Arnett, D. K., & Claas, S. A. (2017). Introduction to epidemiology. In D. Robertson & G. H. Williams (Eds.), Clinical and translational science: Principles of human research (2nd ed., pp. 53–69). Academic Press. https://doi.org/10.1016/B978-0-12-802101-9.00004-1
- Baker, C. (2023). Epidemiology. Open Education Initiative, University Libraries at Virginia Tech. https://doi.org/10.21061/epidemiology
- Bazan, C. N., Hallal, P. C., Hoopsick, R. A., Martenies, S., Schwingel, A., & Tassitano, R. M. (2026). Principles of epidemiology: A primer. Windsor & Downs Press. https://doi.org/10.21900/wd.32
- Bovbjerg, M. L. (2020). Foundations of epidemiology. Oregon State University. https://open.oregonstate.education/epidemiology/
- Brachman, P. S. (1996). Epidemiology. In S. Baron (Ed.), Medical microbiology (4th ed., Chapter 9). University of Texas Medical Branch at Galveston. https://www.ncbi.nlm.nih.gov/books/NBK7993/
- Deal, J. A., Betz, J., Lin, F. R., & Reed, N. S. (2021). Interpreting results from epidemiologic studies. Seminars in Hearing, 42(1), 3–9. https://doi.org/10.1055/s-0041-1725996
- Fajardo-Gutiérrez, A. (2017). Medición en epidemiología: Prevalencia, incidencia, riesgo, medidas de impacto. Revista Alergia México, 64(1), 109–120. https://doi.org/10.29262/ram.v64i1.252
- Gold, S. C., Green, M. D., Chevrier, J., & Eskenazi, B. (2025). Reference guide on epidemiology. In Federal Judicial Center & National Academies of Sciences, Engineering, and Medicine, Reference manual on scientific evidence (4th ed., pp. 897–1026). National Academies Press. https://doi.org/10.17226/26919
- Hajat, C. (2011). An introduction to epidemiology. Methods in Molecular Biology, 713, 27–39. https://doi.org/10.1007/978-1-60327-416-6_3
- Hernandez, J. B. R., & Kim, P. Y. (2022). Epidemiology morbidity and mortality. In StatPearls. StatPearls Publishing. https://www.ncbi.nlm.nih.gov/books/NBK547668/
- Hoffmann, W., Latza, U., Baumeister, S. E., Brünger, M., Buttmann-Schweiger, N., Hardt, J., Hoffmann, V., Karch, A., Richter, A., Schmidt, C. O., Schmidtmann, I., Swart, E., & van den Berg, N. (2019). Guidelines and recommendations for ensuring Good Epidemiological Practice (GEP): A guideline developed by the German Society for Epidemiology. European Journal of Epidemiology, 34(3), 301–317. https://doi.org/10.1007/s10654-019-00500-x
- Institute of Medicine. (2009). Beyond the HIPAA privacy rule: Enhancing privacy, improving health through research. National Academies Press. https://doi.org/10.17226/12458
- Institute of Medicine. (2010). Gulf War and health: Volume 8: Update of health effects of serving in the Gulf War. National Academies Press. https://doi.org/10.17226/12835
- Kurup, K. K., John, D., Ponnaiah, M., & George, T. (2019). Use of systematic epidemiological methods in outbreak investigations from India, 2008–2016: A systematic review. Clinical Epidemiology and Global Health, 7(4), 648–653. https://doi.org/10.1016/j.cegh.2019.02.010
- Mann, C. J. (2003). Observational research methods. Research design II: Cohort, cross sectional, and case-control studies. Emergency Medicine Journal, 20(1), 54–60. https://doi.org/10.1136/emj.20.1.54
- Manson, J. E., & Bassuk, S. S. (2017). Invited commentary: The Framingham Offspring Study—A pioneering investigation into familial aggregation of cardiovascular risk. American Journal of Epidemiology, 185(11), 1103–1108. https://doi.org/10.1093/aje/kwx068
- Meldrum, M. (1998). “A calculated risk”: The Salk polio vaccine field trials of 1954. BMJ, 317(7167), 1233–1236. https://doi.org/10.1136/bmj.317.7167.1233
- Morse, S. A., & Khan, A. S. (2005). Epidemiologic investigation for public health, biodefense, and forensic microbiology. In R. G. Breeze, B. Budowle, & S. E. Schutzer (Eds.), Microbial forensics (pp. 157–171). Academic Press. https://doi.org/10.1016/B978-012088483-4/50011-1
- National Academies of Sciences, Engineering, and Medicine. (2017). Using 21st century science to improve risk-related evaluations. National Academies Press. https://doi.org/10.17226/24635
- National Research Council. (1997). Environmental epidemiology, volume 2: Use of the gray literature and other data in environmental epidemiology. National Academies Press. https://doi.org/10.17226/5804
- National Research Council. (2001). Evaluating chemical and other agent exposures for reproductive and developmental toxicity. National Academies Press. https://doi.org/10.17226/10007
- Nsubuga, P., White, M. E., Thacker, S. B., Anderson, M. A., Blount, S. B., Broome, C. V., Chiller, T. M., Espitia, V., Imtiaz, R., Sosin, D., Stroup, D. F., Tauxe, R. V., Vijayaraghavan, M., & Trostle, M. (2006). Public health surveillance: A tool for targeting and monitoring interventions. In D. T. Jamison, J. G. Breman, A. R. Measham, G. Alleyne, M. Claeson, D. B. Evans, P. Jha, A. Mills, & P. Musgrove (Eds.), Disease control priorities in developing countries (2nd ed., pp. 997–1018). World Bank and Oxford University Press. https://www.ncbi.nlm.nih.gov/books/NBK11770/
- Pérez-Guerrero, E. E., Guillén-Medina, M. R., Márquez-Sandoval, F., Vera-Cruz, J. M., Gallegos-Arreola, M. P., Rico-Méndez, M. A., Aguilar-Velázquez, J. A., & Gutiérrez-Hurtado, I. A. (2024). Methodological and statistical considerations for cross-sectional, case–control, and cohort studies. Journal of Clinical Medicine, 13(14), 4005. https://doi.org/10.3390/jcm13144005
- Song, J. W., & Chung, K. C. (2010). Observational studies: Cohort and case-control studies. Plastic and Reconstructive Surgery, 126(6), 2234–2242. https://doi.org/10.1097/PRS.0b013e3181f44abc
- Songer, T., & Welburn, S. (n.d.). Introduction to epidemiology. University of Pittsburgh. https://pressbooks.pub/epidemiology/
- Thiese, M. S. (2014). Observational and interventional study design types; an overview. Biochemia Medica, 24(2), 199–210. https://doi.org/10.11613/BM.2014.022
- Tsao, C. W., & Vasan, R. S. (2015). Cohort profile: The Framingham Heart Study (FHS): Overview of milestones in cardiovascular epidemiology. International Journal of Epidemiology, 44(6), 1800–1813. https://doi.org/10.1093/ije/dyv337
- Verani, J. R., Baqui, A. H., Broome, C. V., Cherian, T., Cohen, C., Farrar, J. L., Feikin, D. R., Groome, M. J., Hajjeh, R. A., Johnson, H. L., Madhi, S. A., Mulholland, K., O’Brien, K. L., Parashar, U. D., Patel, M. M., Rodrigues, L. C., Santosham, M., Scott, J. A., Smith, P. G., . . . Zell, E. R. (2017). Case-control vaccine effectiveness studies: Preparation, design, and enrollment of cases and controls. Vaccine, 35(25), 3295–3302. https://doi.org/10.1016/j.vaccine.2017.04.037
- Wakeford, R. (2015). Association and causation in epidemiology—Half a century since the publication of Bradford Hill’s interpretational guidance. Journal of the Royal Society of Medicine, 108(1), 4–6. https://doi.org/10.1177/0141076814562713