UV-Vis Spectroscopy, short for Ultraviolet-Visible Spectroscopy, is an analytical technique widely used in the fields of chemistry, physics, biochemistry, and molecular biology. It’s based on the absorption or transmission of UV and visible light by substances.
At its core, UV-Vis Spectroscopy involves shining ultraviolet or visible light through a sample and measuring how much of the light is absorbed. This absorption occurs because the electrons in the molecules of the sample can absorb energy from the light, promoting them to higher energy levels. The amount and wavelength of the absorbed light provide valuable insights into the molecular structure and concentration of the sample.
The spectrum obtained in UV-Vis Spectroscopy typically shows the absorbance or transmittance of the sample as a function of the light’s wavelength. This spectrum is characteristic of the specific chemical bonds and electronic transitions within the molecules, thus it can be used for qualitative and quantitative analysis. For example, it’s commonly used to determine the concentration of a solute in a solution, as the absorbance is directly proportional to the concentration according to Beer-Lambert Law.
The simplicity, speed, and versatility of UV-Vis Spectroscopy, along with the minimal sample preparation required, make it a staple technique in many scientific and industrial laboratories.
What is UV-Vis Spectroscopy?
- UV-Vis Spectroscopy, often shortened to UV Spectroscopy, is a method that involves understanding how light, particularly in the ultraviolet and visible spectrum, interacts with atoms, ions, or molecules in a sample. This interaction leads to the movement of these particles from one energy state to another. Specifically, in UV spectroscopy, light within the ultraviolet range (200-400 nm) is absorbed by molecules, causing their electrons to jump from a lower energy state (ground state) to a higher one.
- This form of spectroscopy is notable for its versatility. It is not only cost-effective but also non-destructive, allowing the same sample to be used for subsequent analyses. It’s used both qualitatively and quantitatively, often employing the Beer-Lambert law to compare the light absorbed or transmitted by a sample against a blank or reference sample. The technique is typically performed under vacuum conditions.
- The wavelength range for UV-Vis Spectroscopy spans from 190 nm to 800 nm, covering both the ultraviolet (190 to 400 nm) and visible (400 to 800 nm) light spectrum. The ultraviolet range is further divided into the near UV (190-400 nm) and the far UV (below 200 nm). A key aspect to remember is that shorter wavelengths correlate with higher frequency and energy, primarily observed in the UV region. Conversely, longer wavelengths correspond to lower frequency and energy, typical of the visible region.
- The data obtained from UV-Vis Spectroscopy are crucial for identifying and quantifying substances in a sample. The technique is adaptable to various sample types, including liquids, solids, powders, and thin films, with its efficacy being influenced by the composition and concentration of the sample.
- Two important concepts in UV-Vis Spectroscopy are Absorbance (A) and Transmittance (T). Absorbance, also known as optical density (OD), is a measure of how much light a sample absorbs and is calculated using the formula: Absorbance (A) = -log(T). On the other hand, Transmittance represents the amount of light that passes through the sample compared to the light passing through a blank, calculated as T = I/Io, where I is the intensity of light through the sample, and Io is the intensity through the blank.
What is the main purpose of UV Vis spectroscopy?
The main purpose of UV spectroscopy, a crucial technique in analytical chemistry, is to identify and quantify substances within a sample by analyzing how they absorb ultraviolet light. This process is based on the principle that different molecules absorb UV light at different wavelengths and intensities.
Here are some of the key objectives and applications of UV spectroscopy:
- Identification of Substances: UV spectroscopy can help determine the chemical identity of a compound. Different compounds absorb UV light at specific wavelengths, creating a unique absorption spectrum that acts like a molecular fingerprint.
- Quantitative Analysis: It is widely used for quantifying the concentration of a substance in a mixture. According to the Beer-Lambert Law, the amount of light absorbed by a substance is directly proportional to its concentration, allowing for accurate measurements.
- Study of Molecular Structure: The absorption pattern in UV spectroscopy can provide insights into the molecular structure of a compound. It helps in understanding the electronic structure and the nature of chemical bonds within a molecule.
- Purity Analysis: It can assess the purity of a sample by detecting the presence of impurities. Unintended absorption peaks can indicate contaminants or impurities in the sample.
- Kinetic Studies: UV spectroscopy is also used in monitoring the progress of chemical reactions by measuring the change in concentration of reactants or products over time.
- Biochemical Applications: In biochemistry, it is used to study biological macromolecules, such as proteins and nucleic acids. For example, it can measure the concentration of DNA or RNA in a solution.
- Pharmaceutical Applications: In the pharmaceutical industry, UV spectroscopy is employed for drug testing and development, ensuring the quality and concentration of active pharmaceutical ingredients.
Which solvent is used in UV spectroscopy?
The solvent used in UV spectroscopy depends on the nature of the sample being analyzed and the specific application. Some common solvents used in UV spectroscopy include:
- Water: Water is often used as a solvent for UV spectroscopy of polar compounds, such as acids, bases, and biomolecules.
- Alcohols: Alcohols like methanol and ethanol are commonly used as solvents for UV spectroscopy of organic compounds.
- Acetonitrile: Acetonitrile is a polar, aprotic solvent that is often used for UV spectroscopy of polar compounds and for samples that are not soluble in water or alcohols.
- Dichloromethane: Dichloromethane (DCM) is a non-polar solvent that is often used for UV spectroscopy of non-polar compounds.
- Hexane: Hexane is also a non-polar solvent that is often used for UV spectroscopy of non-polar compounds.
It is important to note that some solvents absorb in the UV region, so the choice of solvent should be chosen carefully. In general, a solvent should be transparent in the region of the spectrum where the sample absorbs.
UV Visible Spectroscopy Principle
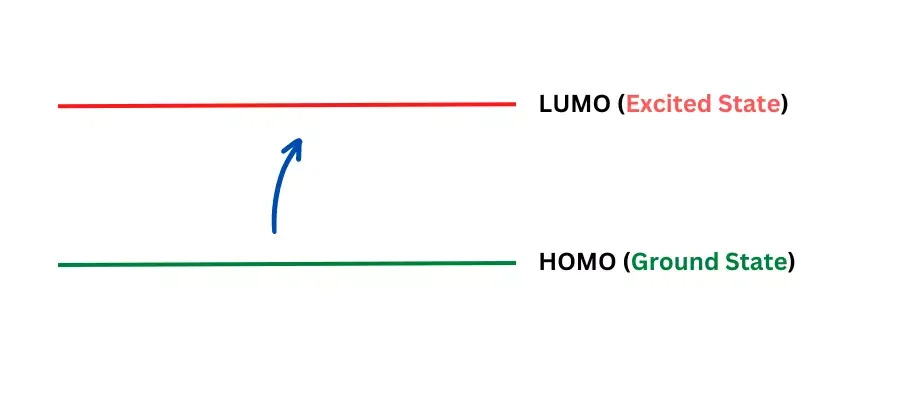
UV Visible Spectroscopy, often simplified to UV-Vis Spectroscopy, operates on a fundamental principle involving the interaction of light with molecules. Let’s break it down in an easy-to-understand manner:
- Electron Excitation: When light of a certain wavelength strikes a molecule, it can cause the electrons in the molecule to become excited. This means the electrons move from a lower energy state (ground state) to a higher energy state. This transition occurs because the electrons in the lower energy orbital absorb the energy from the light to jump to a higher orbital.
- Energy Transformation: This process follows the principle that energy is not created or destroyed, but rather transformed. In UV-Vis Spectroscopy, we use electromagnetic radiation (EMR) in the range of 200-800 nm. The molecule absorbs light that precisely matches the energy needed for an electron to transition between specific energy levels. These energy levels in matter are quantized, meaning they are fixed and not continuous.
- Absorption of Light: When the energy is absorbed by the electrons, there is a corresponding decrease in the intensity of the light. The energy absorbed is equal to the difference between the two energy levels.
- Electron Transitions and Spectra: This electron transition leads to the generation of what we call absorption spectra. On the other hand, when electrons move from a higher energy level back to the ground state, they emit light, producing emission spectra. This is why the technique is also referred to as electron spectroscopy.
- Beer-Lambert Law: A key principle underlying absorbance spectroscopy is the Beer-Lambert Law. This law states that the decrease in light intensity through a medium is directly proportional to the intensity of the incoming light and the thickness of the medium.
- Quantifying Concentration: The Beer-Lambert Law also relates absorbance to the concentration of the substance in a solution. The absorbance (A) is directly proportional to the path length (l), the concentration (c) of the solution, and the molar absorptivity (e) of the compound. The equation A = ecl encapsulates this relationship.
- Calibration Graph: By plotting absorbance against concentration for solutions of known concentrations, we obtain a calibration graph. This graph should ideally be a straight line, allowing for the determination of unknown concentrations in other samples using their absorbance values.
In summary, UV-Vis Spectroscopy revolves around how light interacts with molecules, causing electron transitions that can be measured and analyzed to determine various properties of the substance, including its concentration.
Electronic transitions
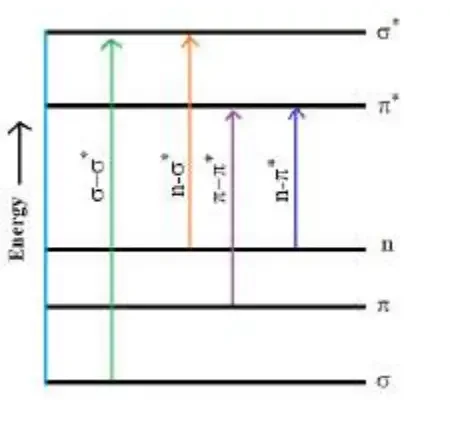
When a molecule absorbs electromagnetic radiation in the UV-visible region and becomes excited, its electrons are promoted from the ground state to the excited state or from the bonding orbital to the anti-bonding orbital.
- 𝜎 − 𝜎* Transition: 𝜎 − 𝜎* represents the transition of an electron from a bonding sigma orbital (𝜎) to an anti-bonding sigma orbital ( 𝜎 *). In alkanes, for instance, all the atoms are bound together by a sigma bond.
- 𝑛 − 𝜎* & 𝑛 − 𝜋* Transition: Transitions from non-bonding molecular (𝑛) orbital to anti-bonding sigma orbital or anti-bonding pi orbital (𝜋 * ), are represented by 𝑛 − 𝜎 * or 𝑛 − 𝜋 * transition respectively. These transition required less energy than 𝜎 − 𝜎 * transition. For example, alkyl halide, aldehydes, ketones etc.
- 𝜋 − 𝜋* Transition: This type of transition generally show in unsaturated molecules like alkenes, alkynes, aromatics, carbonyl compounds etc. This transition required less energy as compare to 𝑛 − 𝜎 * transition.

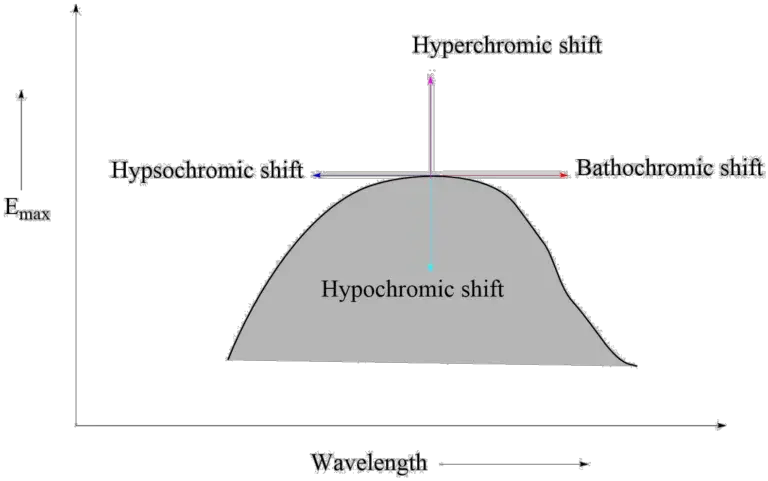
Absorption, intensity shift & UV spectrum
- Bathochromic effect: An effect in which the absorption maximum is shifted to a longer wavelength due to the presence of an autochrome or a solvent change. Red shifts are also known as bathochromic shifts.
- Hypsochromic shifts: This refers to the phenomenon in which the absorption maximum is shifted toward a shorter wavelength. It is also known as the blue shift. It may be caused by removing conjugation and altering the polarity of the solvent.
- Hyperchromic effect: This is an effect in which the maximum absorption intensity, Emax, increases. B-band for pyridine at 275 mμ, Emax 2750 moved to 262 mμ, 2-methyl pyridine Emax 3560. Typically, the addition of autochrome increases the intensity of absorption.
- Hypochromic effect: Hypochromic effect is described as the decrease in the maximum intensity of absorption, or the decrease in the extinction coefficient Emax. The hypochromic effect is caused by the insertion of the group which changes the geometry of the molecule.
Types of absorption bands
There are several types of absorption bands that can be observed in the spectra of molecules:
- Rotational absorption bands: These occur when the rotation of a molecule causes a change in the dipole moment of the molecule. Rotational absorption bands are typically observed in the microwave and far-infrared regions of the spectrum.
- Vibrational absorption bands: These occur when the vibrational motion of a molecule causes a change in the dipole moment of the molecule. Vibrational absorption bands are typically observed in the infrared region of the spectrum.
- Electronic absorption bands: These occur when the electronic structure of a molecule changes as a result of absorption of light. Electronic absorption bands are typically observed in the ultraviolet and visible regions of the spectrum.
- Nuclear magnetic resonance (NMR) absorption bands: These occur when the nuclei of certain atoms (such as hydrogen, carbon, and phosphorus) in a molecule absorb energy in the radiofrequency region of the spectrum. NMR spectroscopy is widely used in analytical chemistry and biochemistry to study the structure and dynamics of molecules.
- Raman scattering bands: They are caused by inelastic scattering of light. It occurs when a photon is scattered by a molecule, but with a change in energy, which results in a shift in wavelength. Raman scattering is typically observed in the visible and near infrared regions and it is used to study the vibrational modes of a molecule.
Types of UV-Visible spectroscopy
Ultraviolet-Visible (UV-Vis) Spectrophotometry, a pivotal technique in analytical chemistry, employs various types of spectrometers to analyze samples. Delving into the details, there are primarily two types of UV-Vis spectrophotometers:

- Single Beam UV-Visible Spectrophotometer:
- As the name suggests, a single beam UV-Vis spectrophotometer utilizes a singular beam of light. The process begins with the incident light emanating from the source, which is subsequently passed through a monochromator. This monochromatic light then traverses a slit and proceeds to pass through the sample solution. During this phase, a portion of the incident light is absorbed by the sample, while the remainder is transmitted.
- The transmitted light is then detected by a specialized detector. Following detection, the light is amplified and recorded, culminating in its display on an appropriate readout device. A spectrum is then plotted, and the λmax (wavelength of maximum absorbance) is identified.
- The integral components of a single beam UV-Vis spectrophotometer encompass:
- Light source
- Lens
- Gratings
- Wavelength selector
- Sample container or cuvette
- Detector
- Digital meter or Recorder
- Double Beam UV-Visible Spectrophotometer:
- The foundational instrumentation of both single and double beam spectrophotometers remains largely analogous. However, the distinguishing feature of a double beam UV-Vis spectrophotometer is its ability to simultaneously direct the beam of incident light towards both the reference and the sample cuvettes.
- The incident light undergoes a division and is channeled towards the reference and sample cuvette in tandem. The beams that are refracted or transmitted are subsequently detected by detectors. It’s imperative to note that a double beam UV-Vis spectrophotometer necessitates two detectors. These detectors are pivotal in detecting the electron ratio, which is instrumental in measuring or calculating the absorbance in a test sample.
- Additionally, a double beam UV-Vis spectrophotometer mandates a stabilized voltage supply to ensure accurate and consistent readings.
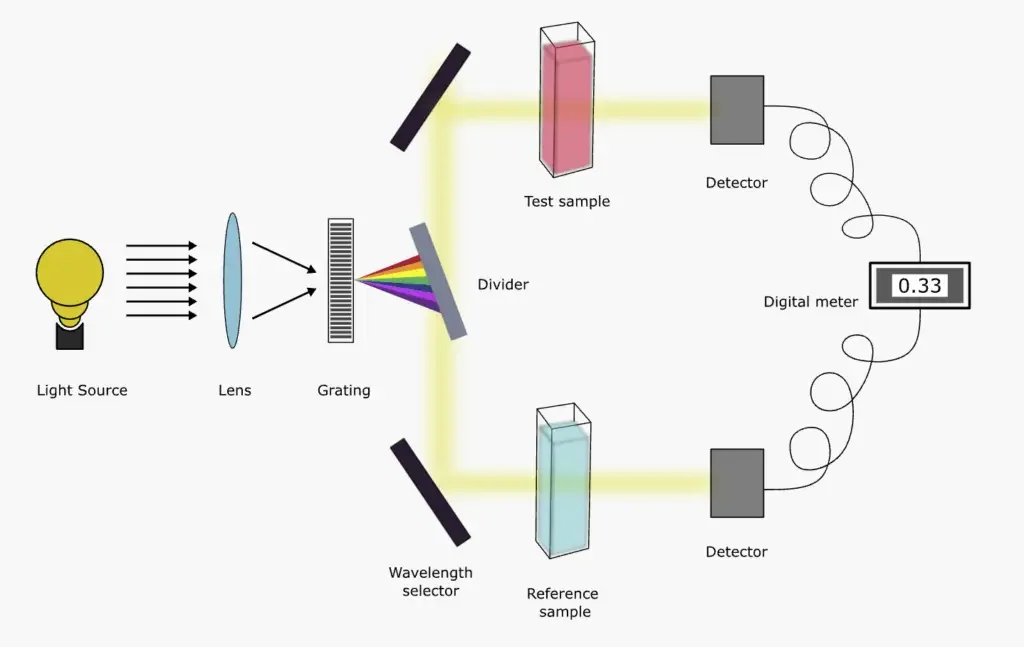
Instrumentation of UV-Vis Spectroscopy

UV-Vis Spectroscopy, an important analytical tool, relies on several key components to function effectively. Here’s an overview of these components:
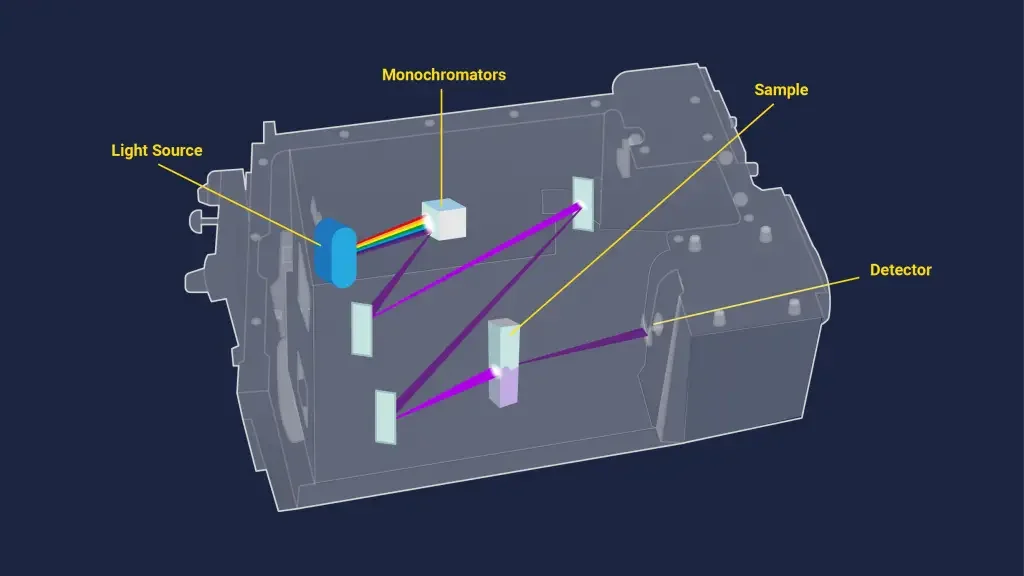
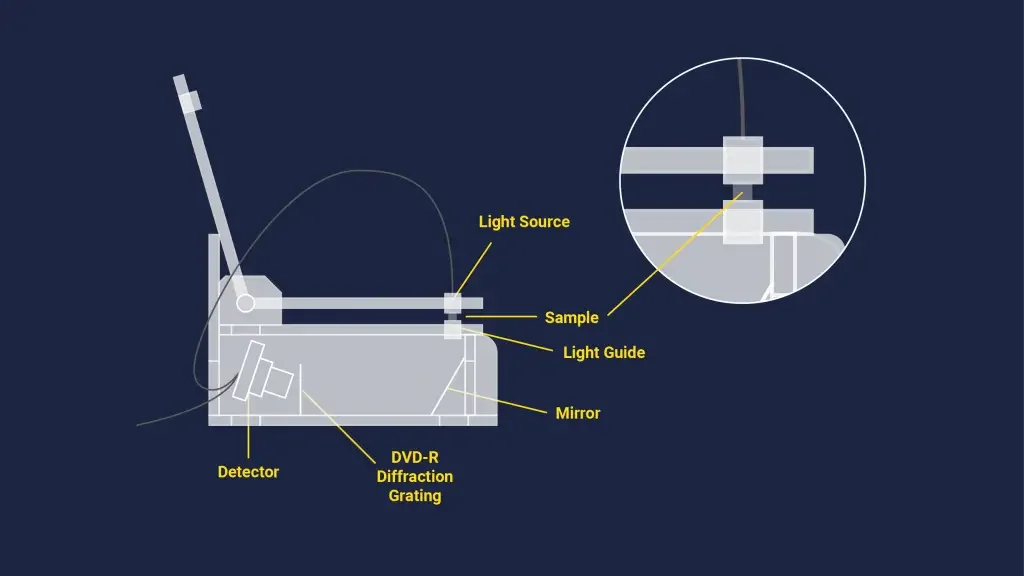
- Light Source: The light source is crucial in a UV-Vis spectrophotometer, as it emits a broad range of wavelengths covering both UV and visible light. Typically, two types of lamps are used: a deuterium lamp for UV light and a halogen or tungsten lamp for visible light. These lamps ensure a strong and consistent light output. The spectrometer switches between these two lamps, usually around the wavelength range of 300-350 nm, to ensure smooth transition and consistent light emission in both UV and visible ranges.
- Wavelength Selector: This component is responsible for selecting the appropriate wavelength of light from the source to be used in analyzing the sample. The most common type of wavelength selector in a UV-Vis spectrometer is a monochromator. It works by separating the incoming light into narrow bands of wavelengths using a prism, which bends the light and produces a spectrum. Only light of a specific wavelength is allowed to pass through the exit slit of the monochromator and reach the sample.
- Sample Container: The sample container or cuvette holds the sample through which the light passes. There are two types of spectrophotometers based on how they handle the light beam: single-beam and double-beam. In a single-beam spectrophotometer, all light passes through the sample, while in a double-beam spectrophotometer, the light is split into two paths – one passes through the sample and the other through a reference. This setup helps to measure the absorbance of the sample more accurately by comparing it with the reference. The cuvettes are usually made of materials like fused silica or quartz, especially for UV and visible light.
- Detector: The detector’s role is to convert the light that has passed through the sample into an electrical signal. This signal is proportional to the light’s intensity. Detectors are designed to be sensitive and produce low noise, ensuring accurate measurements. They vary in their wavelength range and sensitivity.
The working of the spectrophotometer can be understood through the Beer-Lambert Law. This law relates the absorbance of light to the properties of the material through which the light is passing. The absorbance (A) is calculated using the equation A = -log(T) = -log(I/Io), where ‘I’ is the intensity of light that passes through the sample, and ‘Io’ is the intensity of the incident light. The transmittance (T), which is I/Io, represents the fraction of light that has passed through the sample. This relationship helps in determining the concentration of the substance in the sample.
Types of Detectors in UV-Visible Spectroscopy
In the domain of UV-Visible spectroscopy, detectors play an indispensable role. Their primary function is to convert light into proportional electrical signals, which subsequently determine the spectrophotometer’s response. Delving into the technicalities, there are four primary types of detectors utilized in UV-Visible spectroscopy. Therefore, for a comprehensive understanding, let’s explore each type in detail.
- Phototube: The phototube, also referred to as a photoelectric cell, is a detector filled with gas under low pressure. Within its evacuated quartz envelope, it houses a light-sensitive cathode and an anode. A potential difference of approximately 100 V is applied between these electrodes. When a photon enters the tube, it strikes the cathode, leading to the ejection of an electron. This electron, upon hitting the anode, results in the flow of current. However, the resultant current is of low intensity and necessitates amplification. The response of the phototube is contingent on the wavelength of the incident light. Phototubes operate based on the photoelectric effect, where light is absorbed by a metallic surface with a low work function. To prevent excessive current density on a part of the cathode, a larger spot on the photocathode is illuminated. However, due to thermionic emission at longer wavelengths, a dark current may be generated, necessitating cooling with liquid nitrogen.
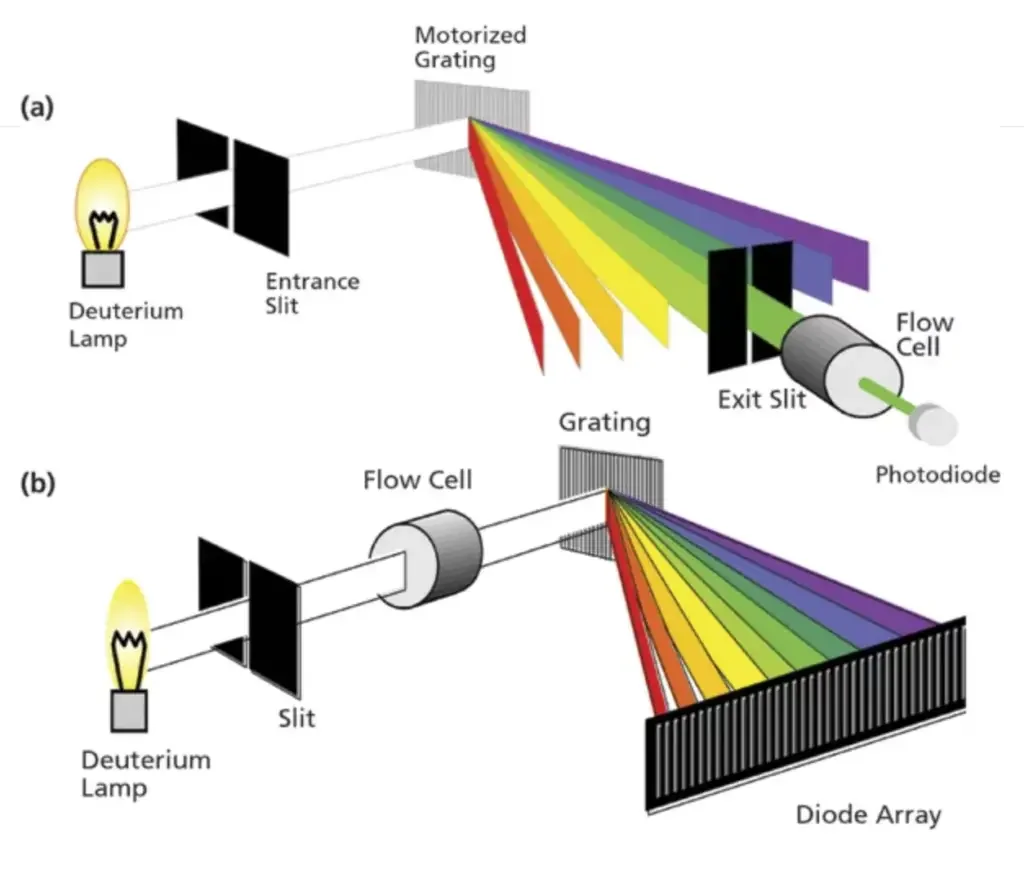
- Photomultiplier Tube: The photomultiplier tube stands as a popular detector in contemporary UV-Vis spectrophotometers. Its structure comprises an anode, cathode, and multiple dynodes. When a photon enters the tube, it strikes the cathode, leading to the emission of electrons. These electrons are subsequently accelerated towards the first dynode, resulting in the production of several electrons. This process is reiterated across the dynodes, amplifying the number of electrons. The primary advantages of this detector include its ability to detect very low light levels, high wavelength resolution, and faster response time. However, it is susceptible to damage when exposed to high-intensity light.
- Diode Array Detector: A diode array detector is a multichannel photon detector capable of measuring all wavelengths of dispersed radiation simultaneously. It comprises an array of silicon photodiodes on a single silicon chip. Each diode in the array is reverse biased, and individual diode circuits are sequentially scanned. The primary advantage of this detector is its ability to record the complete spectrum in a short time frame. However, it may present challenges such as relevant dark current and high read noise.
- Charge Coupled Device (CCD): The CCD is renowned for its high sensitivity, making it ideal for detecting extremely low light intensity signals. Structurally similar to diode array detectors, CCDs utilize photo capacitors instead of diodes. Each photocapacitor in a CCD comprises millions of detector elements termed pixels. The silicon chip within the CCD converts light into an electric signal, with the buildup of charges corresponding to the pattern of the incident light. CCDs are known for their low dark count rate, high UV-Vis quantum efficiency, and low read noise.
Factors affecting UV-Vis Spectroscopy
UV-Vis spectroscopy, a cornerstone technique in analytical chemistry, is influenced by a myriad of factors that can alter the results and spectra obtained. For a comprehensive understanding, let’s delve into a detailed and sequential explanation of each factor.
- Effect of Sample Temperature: Temperature variations in the sample can significantly influence the spectrum. As the temperature decreases, the sharpness of absorption bands intensifies. However, the total absorption intensity remains unaffected by temperature changes. Lower temperatures also reduce the rotational and vibrational energy states of molecules, producing finer absorption bands. Therefore, for precision, it’s imperative to maintain a consistent or specific temperature when obtaining the spectrum.
- Effect of Sample Concentration: The concentration of the sample directly correlates with the intensity of light absorption. High concentrations can lead to molecular interactions, altering the shape and position of absorption bands. The solvent’s nature also plays a pivotal role, with polar solvents producing broader bands compared to non-polar solvents. Thus, understanding the solvent-solute interactions is crucial for accurate spectral interpretation.
- Effect of Sample pH: The pH of the solution can markedly affect the absorption spectra of certain compounds. For instance, changes in pH can alter the spectra of aromatic compounds like amines and phenols. Acid-base indicators, due to their absorptions in the visible region, are particularly sensitive to pH changes. Maintaining a constant pH, often using buffer solutions, is essential for consistent spectral results.
- Effect of Solvent: The solvent in which the molecule is dissolved can shift the absorption peak. Polar solvents, for instance, can form hydrogen bonds with the substance, shifting the absorption bands of polar molecules. The spectrum recorded in a non-polar solvent can differ significantly from that in a polar solvent due to these interactions.
- Effect of Steric Hindrance: The molecular configuration, especially in terms of planarity and conjugation, can influence the spectrum. Steric hindrance, which prevents molecules from existing in a planar configuration, can shift the absorption peak. Geometric isomerism, particularly the difference between trans and cis isomers, also plays a role in determining the spectrum.
- Effect of Conjugation: Conjugation in molecules can shift the absorption peak. When chromophores are conjugated, the absorption peak shifts to a longer wavelength. An increase in the number of conjugated bonds can lead to the absorption of visible light, imparting color to compounds.
Types of Cuvette and Compatible Wavelengths for UV-Vis spectroscopy
In the realm of UV-Vis spectroscopy, the cuvette plays a pivotal role as it holds the sample to be analyzed. The material from which a cuvette is made determines its compatibility with specific wavelengths, thereby influencing the accuracy and range of measurements. Here’s a detailed exposition on the various cuvette materials and their respective wavelength compatibilities:
- Pyrex Glass or Optical Glass Cuvettes:
- Material Composition: These cuvettes are primarily made from polystyrene, PMMA, and glass.
- Wavelength Compatibility: They are suitable for the visible radiation range, boasting a transmission range from 340 nm to 2500 nm.
- Applications: Given that a majority of spectroscopic applications fall within this range, these cuvettes are commonly used.
- Cost Consideration: For those with budget constraints, optical glass cuvettes are a viable choice due to their affordability.
- UV Quartz Cuvettes:
- Material Composition: UV quartz is a specialized type of plastic, distinct from regular optical glass.
- Wavelength Compatibility: These cuvettes have an extended transmission range from 190 nm to 2500 nm, encompassing the UV spectroscopy range.
- Applications: They are indispensable for UV spectra measurements, given their compatibility with ultraviolet wavelengths.
- Cost Consideration: Being superior to optical glass in terms of transmission range, UV quartz cuvettes are priced higher.
- IR Quartz Cuvettes:
- Material Composition: IR quartz is a refined material tailored for UV-Vis experiments.
- Wavelength Compatibility: They offer a transmission range of 220 nm to 3500 nm, covering both the IR and some UV regions.
- Applications: Ideal for experiments that require measurements in both the UV and IR spectra.
- Cost Consideration: Their broader range and enhanced quality make them a pricier option compared to UV quartz and optical glass cuvettes.
- Sapphire Cuvettes:
- Material Composition: Sapphire is renowned for its hardness and resistance to scratches.
- Wavelength Compatibility: These cuvettes have an impressive transmission range of 250 nm to 5000 nm.
- Applications: Given their broad optical range, they are suitable for diverse spectroscopic applications.
- Unique Features: Besides their broad transmission range, sapphire cuvettes are resistant to electrical, thermal, and chemical damage.
- Cost Consideration: Owing to their superior material quality and extensive transmission range, sapphire cuvettes are among the most expensive.
Selection of Cuvette in Ultraviolet Visible Spectroscopy
The choice of cuvette material can significantly influence the accuracy and reliability of the results. Therefore, understanding the nuances of cuvette selection is paramount.
- UV-Vis Absorbance Cut-off:
- Every cuvette material possesses a specific UV-Vis absorbance cut-off. Below this cut-off value, the solvent within the cuvette absorbs the light, potentially skewing results.
- Material Considerations:
- For measurements in the UV spectrum, a quartz cuvette is imperative due to its transparency in this range.
- In the visible spectrum, one has the flexibility to choose between glass, plastic, and quartz cuvettes.
- For experiments demanding high purity, disposable plastic cuvettes are favored as they curtail the risk of contamination.
- While aqueous solutions are amenable to any cuvette type, organic solvents necessitate the use of glass cuvettes due to their superior solvent resistance compared to their plastic counterparts.
- Durability and Reusability:
- Plastic cuvettes, although cost-effective, have limited reusability.
- In contrast, glass and quartz cuvettes, being reusable materials, can be meticulously cleaned and maintained for prolonged use. Their longevity makes them a cost-effective choice in the long run.
- Quartz, with its enhanced light transmission capabilities and transparency, is the go-to choice for sensitive experiments. Its resilience to temperature fluctuations further underscores its utility.
- Polishing:
- Cuvettes can be polished on either two or all four sides.
- Given that light traverses the sample linearly, a two-sided polish suffices for most UV-Vis spectroscopy applications, ensuring optimal light transmittance.
- However, for specialized experiments like fluorescence and scattering, where the signal is captured at a 90° angle to the incident light, a four-sided polish becomes essential.
Advantages of UV-Vis spectroscopy
- Non-Destructive Nature:
- One of the primary advantages of UV-Vis Spectroscopy is its non-destructive nature.
- This means that post-analysis, the sample remains intact and unaltered, allowing for its reuse or further processing in subsequent experiments or analyses.
- Speed and Efficiency:
- UV-Vis Spectroscopy facilitates rapid measurements.
- This swift nature ensures that it can be seamlessly integrated into various experimental protocols, enhancing the efficiency of the overall research process.
- User-Friendly Instruments:
- Instruments used in UV-Vis Spectroscopy are notably user-friendly.
- Their straightforward design and operation mean that users require minimal training before they can effectively utilize the equipment.
- Simplified Data Analysis:
- The data procured from UV-Vis Spectroscopy typically requires minimal processing.
- This simplicity in data analysis further reduces the need for extensive user training, ensuring that even novices can interpret the results with ease.
- Cost-Effectiveness:
- From an economic standpoint, UV-Vis Spectroscopy instruments are generally affordable.
- Not only is the initial acquisition cost reasonable, but the operational expenses are also relatively low. This cost-effectiveness makes the technique accessible to a wide range of laboratories, from academic settings to industrial research facilities.
Limitations of UV-Vis spectroscopy (DIsadvantages)
- Stray Light:
- In practical scenarios, wavelength selectors in UV-Vis instruments are not flawless. They might inadvertently transmit a minor amount of light from a broader wavelength range originating from the light source.
- Such stray light can introduce significant measurement errors.
- Additionally, stray light can also emanate from external environments or due to improperly fitted compartments within the instrument.
- Light Scattering:
- Light scattering is predominantly caused by suspended solids present in liquid samples. This phenomenon can lead to substantial measurement inaccuracies.
- The presence of air bubbles within the cuvette or the sample can further exacerbate light scattering, leading to inconsistent results.
- Interference from Multiple Absorbing Species:
- A single sample might contain multiple chemical species that absorb light. For instance, a sample could have various types of chlorophyll, each with its unique absorption spectrum.
- When these species are analyzed together, their spectra might overlap, complicating the analysis.
- For accurate quantitative analysis, it’s imperative to separate each chemical species from the sample and analyze them individually.
- Geometrical Considerations:
- The precise alignment of the instrument’s components is paramount for accurate results. Any misalignment, especially concerning the cuvette holding the sample, can lead to inconsistent and erroneous outcomes.
- Every component must maintain a consistent orientation and position for each measurement to ensure reproducibility.
- Given these geometrical sensitivities, it’s recommended that users undergo basic training to prevent potential misuse and misalignment.
Applications of UV-Vis spectroscopy
- Identification of Species:
- UV-Vis spectroscopy plays a pivotal role in identifying both organic and inorganic species present in a solution.
- Concentration Determination:
- This technique is adept at determining the concentration of unknown solutions, providing valuable insights into sample composition.
- Structural Elucidation:
- UV-Vis spectroscopy aids in the determination of molecular structures. It provides data on bands and intensities associated with specific functional groups, facilitating a deeper understanding of molecular configurations.
- It is instrumental in detecting the presence or absence of unsaturation and heteroatoms in organic molecules.
- Chemical Kinetics:
- The study of chemical kinetics, specifically the appearance and disappearance of functional groups during reactions, is enhanced using UV-Vis spectroscopy. By passing UV radiation through a reaction cell, absorbance changes can be meticulously observed.
- Isomer Study:
- In the realm of geometric isomerism, UV-Vis spectroscopy offers insights into species differentiation. For instance, trans-species, which absorb at higher wavelengths, exhibit larger molar absorptivity values compared to their cis counterparts.
- Detection of Conjugation:
- The technique is proficient in detecting the presence of conjugation in molecules, further elucidating molecular behavior.
- Impurity Detection:
- UV-Vis spectroscopy stands out as an optimal method for impurity determination in organic molecules. By comparing the sample’s absorption spectrum with that of a standard raw material, impurities can be identified.
- Functional Group Analysis:
- The presence or absence of specific functional groups in compounds can be ascertained using this technique. The absence of a specific band at a designated wavelength serves as evidence of the absence of a particular group.
- Pharmaceutical Applications:
- In the pharmaceutical domain, many drugs, whether in raw material form or as formulations, can be assayed. This is achieved by preparing a suitable solution of the drug and measuring its absorbance at specific wavelengths.
- Molecular Weight Determination:
- By preparing suitable derivatives of compounds, their molecular weights can be determined spectrophotometrically.
- High-Performance Liquid Chromatography (HPLC):
- UV spectrophotometers can be employed as detectors in HPLC, enhancing the precision of chromatographic analyses.
- Miscellaneous Applications:
- UV-Vis spectroscopy finds its utility in clinics for drug analysis, in petrochemical industries, water quality control labs, forensic labs, and even in chemical and biological plants.
FAQ
What are the Applications of UV-Visible Spectroscopy?
UV-Vis spectroscopy is a versatile and widely used analytical technique that has a wide range of applications in various fields, such as:
Analytical chemistry: Determining concentration and identifying unknown compounds
Biochemistry: Studying the structure and function of biomolecules
Environmental science: Monitoring water and air quality, detecting pollutants
Pharmaceuticals: Analysis of drugs, determining purity, monitoring synthesis
Food industry: Measuring concentration of food ingredients and monitoring product quality
Materials science: Studying the electronic and optical properties of materials
Organic chemistry: Identifying functional groups and studying reaction mechanisms
Medical research: Studying properties of blood, glucose level and photochemistry of biological systems
Forensics: Analyzing trace evidence, identifying sample source
Industrial process control: Monitoring chemical reactions, optimizing conditions and controlling final product quality.
What is UV-Visible spectroscopy?
UV-Vis spectroscopy, also known as ultraviolet-visible spectroscopy, is a technique that is used to study the interaction of matter and electromagnetic radiation. It specifically deals with the absorption of ultraviolet (UV) and visible light by a sample. The sample is exposed to a broad range of wavelengths of light and the absorption of light at different wavelengths is measured. The resulting data is plotted as a spectrum, from which the sample’s absorbance or transmittance can be determined. The absorbance or transmittance spectrum can be used to identify the presence of specific functional groups or to determine the concentration of a substance in a solution. UV-Vis spectroscopy is commonly used in analytical chemistry, biochemistry, and materials science, as well as in various industries like Pharmaceuticals, food, water and environment analysis, etc.
What are the limitations of UV Visible Spectroscopy?
The time required to prepare to utilise a UV-VIS spectrometer is the primary drawback of its application. UV-VIS spectrometers must be properly configured. Any external light, electrical noise, or other impurities that could interfere with the spectrometer’s reading must be eliminated.
Why is a glass cuvette not suitable for UV?
A glass cuvette is not suitable for UV spectroscopy because it absorbs UV light, which can interfere with the measurement being taken. Quartz cuvettes are typically used for UV spectroscopy because they are transparent to UV light and do not absorb it.
What is the main difference between UV and IR spectroscopy?
The main difference between UV and IR spectroscopy is the range of wavelengths they use to measure different compounds. UV spectroscopy typically uses wavelengths in the range of 190-400 nm, while IR spectroscopy uses wavelengths in the range of 4000-400 cm-1 (or roughly 750-2.5 µm). UV spectroscopy is useful for studying compounds that have conjugated double bonds or aromatic ring systems, while IR spectroscopy is useful for studying compounds that have vibrations of functional groups such as C-H, C-O, N-H and O-H. UV spectroscopy is more sensitive to changes in the electron density of a compound, while IR spectroscopy is more sensitive to changes in the vibrational energy of a compound.
What is the range of UV-Vis spectroscopy?
The range of UV-Vis (ultraviolet-visible) spectroscopy is typically from 190 nm to 800 nm, although some instruments can measure as low as 175 nm and as high as 2500 nm. This range covers both ultraviolet (UV) and visible regions of the electromagnetic spectrum. The UV region is typically divided into three regions, the vacuum ultraviolet (VUV, < 200 nm), the near ultraviolet (NUV, 200-380 nm) and the far ultraviolet (FUV, 380-200 nm) and the visible region is from 400 nm to 800 nm. The UV-Vis spectroscopy is sensitive to the absorption of light by a compound, which is directly related to its electron density, and can be used to identify and quantify a wide variety of compounds, including transition metal complexes, organic dyes, and biomolecules.
What is the unit of UV spectroscopy?
However, Beer–Lambert’s law is often applied to obtain the concentration of the sample (c) after measuring the absorbance (A) when the molar absorptivity (ε) and the path length (L) are known. Typically, ε is expressed with units of L mol‑1 cm‑1, L has units of cm, and c is expressed with units of mol L‑1.
Why we use HPLC instead of UV?
High-performance liquid chromatography (HPLC) and ultraviolet (UV) spectroscopy are both analytical techniques that can be used to identify and quantify compounds in a mixture, but they have different strengths and are often used in conjunction with each other.
One of the main reasons why HPLC is used instead of UV is that HPLC can separate and isolate individual components in a mixture, while UV spectroscopy typically provides a broad spectrum of all the compounds present in a sample. HPLC allows for the purification and isolation of specific compounds, which can then be further analyzed using UV spectroscopy or other techniques.
Another reason is that HPLC is a highly sensitive technique and can detect and quantify compounds at very low concentrations, while UV spectroscopy is relatively less sensitive. HPLC is also suitable for a wide variety of samples, such as liquid, gases, and even solid samples, while UV spectroscopy is mainly used for liquid samples.
Furthermore, HPLC can be used to identify and quantify a wide range of compounds, including polar, non-polar, ionized and non-ionized compounds, while UV spectroscopy is sensitive to the absorption of light by a compound, which is directly related to its electron density, and it is mainly used for organic compounds.
In summary, HPLC and UV spectroscopy are complementary techniques that are often used together for the analysis of complex samples. HPLC provides separation and isolation of individual components, while UV spectroscopy provides structural and compositional information about the compounds.
Why quartz cuvette is used in UV?
Quartz cuvettes are used in UV spectroscopy because they are transparent to UV light and do not absorb it. Quartz is a type of silica (SiO2) that has a high transmission in the UV-visible region of the spectrum, making it ideal for UV spectroscopy measurements. Quartz cuvettes are also relatively durable and easy to clean, which makes them suitable for use in analytical instruments.
Another reason is that quartz cuvettes have a low thermal expansion coefficient which makes them suitable for use in high-temperature measurements and also in thermal cycling.
Furthermore, quartz cuvettes are also chemically resistant to most of the solvents and samples that are used in UV spectroscopy, this makes them a suitable choice for many applications.
In contrast, glass cuvettes absorb UV light, which can interfere with the measurement being taken. They are not suitable for UV spectroscopy.
In summary, quartz cuvettes are used in UV spectroscopy because they are transparent to UV light, durable, easy to clean, chemically resistant, have low thermal expansion coefficient, and do not absorb UV light, which makes them ideal for use in analytical instruments.
What is the unit of absorbance?
Absorbance is directly proportional to concentration and length: A = εcl. ε is the wavelength-dependent molar absorbtivity coefficient and it is constant for a particular substance. ε has units of L mol – 1 cm – 1.
References
- Harris DC. Quantitative Chemical Analysis. 7th ed, 3rd printing. W. H. Freeman; 2007.
- Diffey BL. Sources and measurement of ultraviolet radiation. Methods. 2002;28(1):4-13. doi:10.1016/S1046-2023(02)00204-9
- Namioka T. Diffraction Gratings. In: Vacuum Ultraviolet Spectroscopy. Vol 1. Experimental Methods in Physical Sciences. Elsevier; 2000:347-377. doi:10.1016/B978-012617560-8/50018-9
- Mortimer Abramowitz and Michael W. Davidson. Photomultiplier Tubes. Molecular Expressions. Accessed April 25, 2021. https://micro.magnet.fsu.edu/primer/digitalimaging/concepts/photomultipliers.html
- Picollo M, Aceto M, Vitorino T. UV-Vis spectroscopy. Phys Sci Rev. 2019;4(4). doi:10.1515/psr-2018-0008
- What is a Photodiode? Working, Characteristics, Applications. Published online October 30, 2018. Accessed April 29, 2021. https://www.electronicshub.org/photodiode-working-characteristics-applications/
- Amelio G. Charge-Coupled Devices. Scientific American. 1974;230(2):22-31. http://www.jstor.org/stable/24950003
- Hackteria. DIY NanoDrop. Accessed June 15, 2021. https://hackteria.org/wiki/File:NanoDropConceptSpectrometer2.png
- Sharpe MR. Stray light in UV-VIS spectrophotometers. Anal Chem. 1984;56(2):339A-356A. doi:10.1021/ac00266a003
- Liu P-F, Avramova LV, Park C. Revisiting absorbance at 230nm as a protein unfolding probe. Anal Biochem. 2009;389(2):165-170. doi:10.1016/j.ab.2009.03.028
- Kalb V., Bernlohr R. A New Spectrophotometric Assay for Protein in Cell Extracts. Anal Biochem. 1977;82:362-371. doi:10.1016/0003-2697(77)90173-7
- Bosch Ojeda C, Sanchez Rojas F. Recent applications in derivative ultraviolet/visible absorption spectrophotometry: 2009–2011. Microchem J. 2013;106:1-16. doi:10.1016/j.microc.2012.05.012
- https://psiberg.com/uv-vis-spectroscopy/
- https://www.lkouniv.ac.in/site/writereaddata/siteContent/202004201521035685ranvijay_engg_UV_and_VISIBLE_SPECTROSCOPY.pdf
- https://jascoinc.com/learning-center/theory/spectroscopy/uv-vis-spectroscopy/
- https://www.technologynetworks.com/analysis/articles/uv-vis-spectroscopy-principle-strengths-and-limitations-and-applications-349865
- https://thechemistrynotes.com/ultraviolet-visible-uv-spectroscopy/
- https://microbiologynotes.org/tag/uv-vis-spectroscopy/
- https://www.scribd.com/document/551763468/UV-Spectroscopy-Principle-Instrumentation-Applications-Instrumentation-Microbe-Notes
- https://prgc.ac.in/uploads/study_material/UV-SPECTROSCOPYHANDOUTBYVIJAYALAKSHMISADA.pdf524.pdf
- https://paramedicsworld.com/biochemistry-practicals/demonstration-of-spectrophotometer-principle-components-working-applications/medical-paramedical-studynotes
- https://lab-training.com/benefits-double-beam-single-beam-uv-visible-spectrophotometers/
- https://www.biologydiscussion.com/biochemistry/spectroscopic-techniques/top-14-types-of-spectroscopic-techniques-explained-biochemistry/12900
- https://chemistnotes.com/organic/uv-visible-spectroscopy-basic-principle-application/
- https://gpatindia.com/atomic-absorption-spectroscopy/
- https://microbenotes.com/uv-spectroscopy-principle-instrumentation-applications/
- Text Highlighting: Select any text in the post content to highlight it
- Text Annotation: Select text and add comments with annotations
- Comment Management: Edit or delete your own comments
- Highlight Management: Remove your own highlights
How to use: Simply select any text in the post content above, and you'll see annotation options. Login here or create an account to get started.