What is fluorescence spectrometry?
- Usually in the UV or visible spectrum, fluorescence spectrometry is an analytical method used to quantify the light produced by a sample following the excitation by a designated wavelength.
- The mechanism is predicated on the Stokes shift: certain molecules absorb energy and then re-emit portion of that energy as light at a larger wavelength.
- Its great sensitivity helps to identify trace analyte levels, usually much above the limits of traditional absorbance methods.
- Fields like biochemistry, environmental science, pharmaceuticals, and forensic investigation apply the approach for both qualitative and quantitative study.
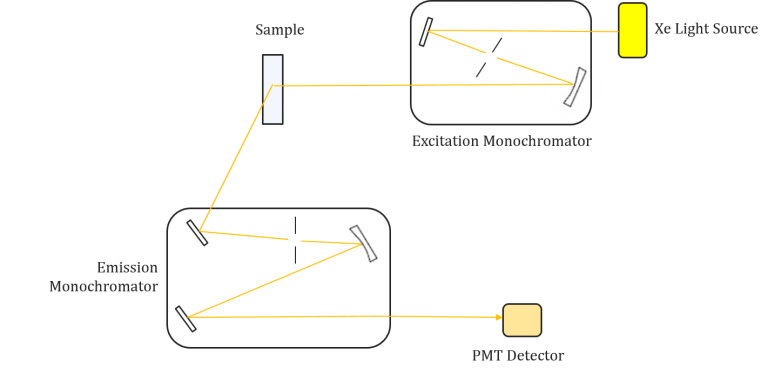
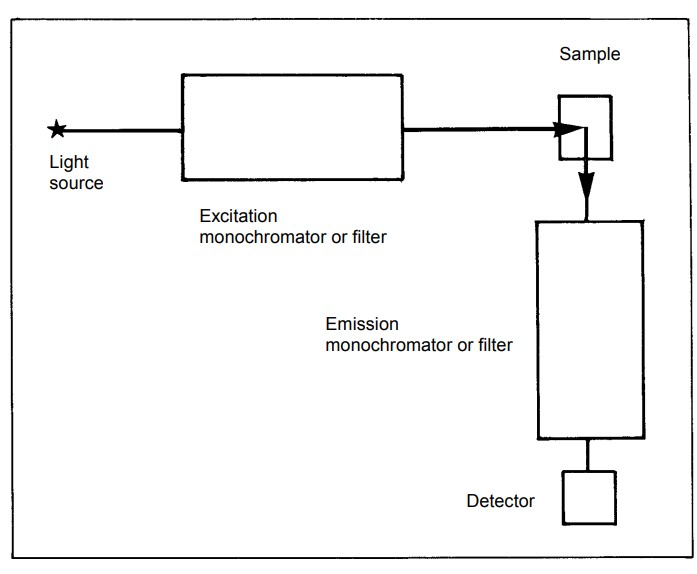
- Typical apparatus comprises a steady light source (e.g., xenon arc lamp or laser), excitation and emission monochromators or filters, a sample chamber, and a sensitive detector such as a photomultiplier tube.
- Sir George Stokes originally described fluorescence in 1852, and during the last century the development of spectrofluorometers has matched changes in optics and electrical detection.
- Through tracking changes in fluorescence intensity, lifespan, and spectral features under various environmental circumstances, the method offers comprehensive insights into molecule structure and dynamics.
- Recent developments have improved detector sensitivity, allowed time-resolved measurements, and integrated fluorescence spectrometry using separation methods like high-performance liquid chromatography for complicated mixture analysis.
- Fluorescence spectrometry is an indispensable instrument for investigating biomolecular interactions and conformational changes as it allows one to investigate the effects of solvent polarity, temperature, and pH on molecular behavior.
- Underlying both basic research and practical scientific inquiries, fluorescence spectrometry is generally a fast, non-destructive, highly selective analytical method.
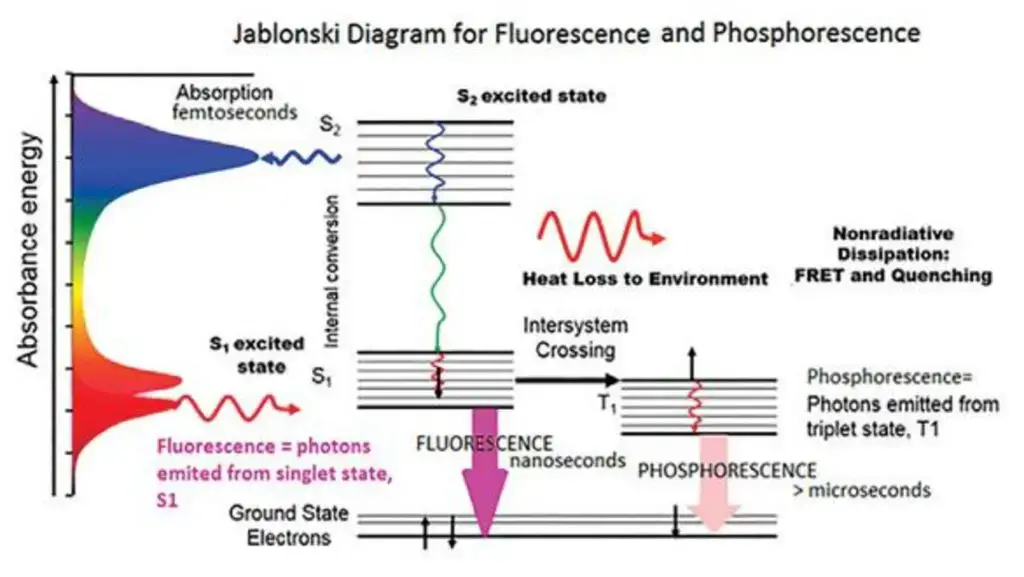
Principle of fluorescence spectroscopy
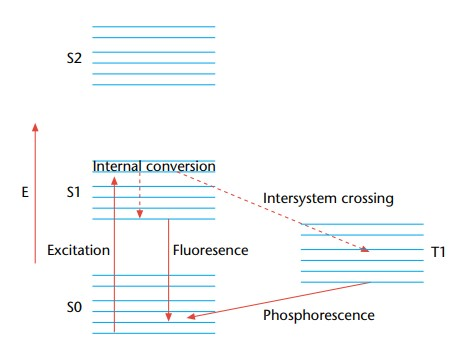
- The basis of fluorescence spectroscopy is the idea that a molecule energized from its ground state (S₀) to a higher electronic state (Sₙ) when it absorbs a photon of light—usually in the ultraviolet or visible range.
- Usually settling in the lowest vibrational level of the initial excited state (S₁), the molecule quickly undergoes vibrational relaxation upon excitation, shedding surplus energy non-radiatively.
- The molecule subsequently goes back to the ground state by releasing a photon; since some energy is lost during vibrational relaxation, the released light has a longer wavelength (lower energy) than the absorbed light—a phenomena sometimes referred to as the Stokes shift.
- The electrical structure of the molecule as well as its interactions with the surrounding environment—solvent polarity, pH, and temperature—are fully revealed by the intensity and spectrum features of the emitted fluorescence.
- In fluorescence spectroscopy, instrumentation usually comprises a light source (e.g., xenon lamp or laser), optical components like excitation and emission monochromators or filters, a sample compartment, and a sensitive detector (such as a photomultiplier tube) to record the weak fluorescence signals.
- Though events like self-quenching and inner-filter effects can impair accuracy at higher concentrations, quantitative fluorescence measurements depend on the linear relationship between fluorescence intensity and fluorophore concentration at low concentrations.
- From analytical chemistry and biochemistry to environmental science and material science, the basic ideas of fluorescence spectroscopy have been extensively used in fields ranging from analytical chemistry and biochemistry to enable studies of molecular structure, dynamics, and interactions at very low concentration levels. Time-resolved fluorescence spectroscopy further analyzes the decay of fluorescence over time and provides insights into the excited state lifetime and dynamic molecular interactions.
Fluorescence Phenomenon
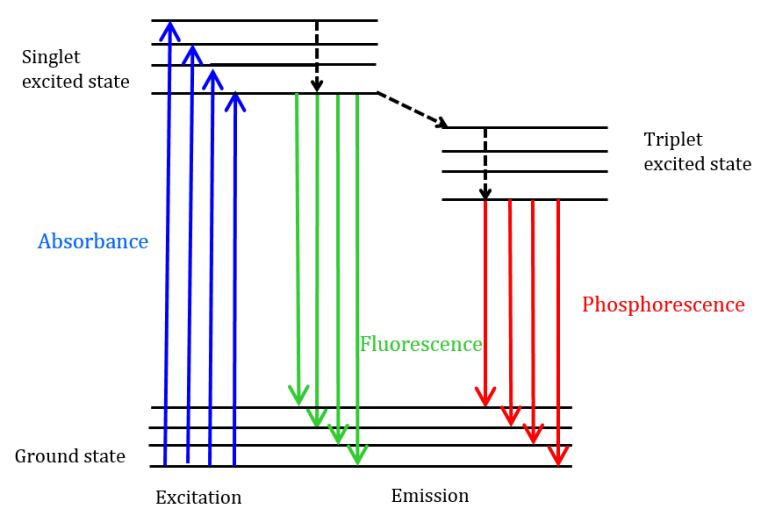
- Fluorescence is a form of photoluminescence in which a material absorbs electromagnetic radiation—usually UV or visible light—then generates longer wavelength light.
- When a fluorophore absorbs a photon, its electrons are stimulated from the ground state (S₀) to a higher electronic state (usually S₁) then fast lose extra vibrational energy by non-radiative mechanisms.
- Stokes shift defines the emission of a photon with reduced energy resulting from the following radiative relaxation from the lowest vibrational level of the excited state back to the ground state.
- The whole process takes nanoseconds, hence fluorescence is a fast event that may be used to track dynamic molecular interactions in real time.
- The quantum yield—that is, the ratio of emitted to absorbed photons—defines the fluorescence’s efficiency and is affected by environmental parameters like solvent polarity, temperature, and quencher presence.
- A Jablonski diagram shows electronic states, vibrational relaxation, and competing non-radiative processes, therefore helping to depict the fundamental processes and transitions in fluorescence.
- Analytical chemistry, biochemistry, and medical diagnostics all benefit from fluorescence’s great sensitivity and selectivity for trace level chemical detection.
- Time-resolved fluorescence and single-molecule detection have advanced their uses and allowed thorough research of molecular dynamics and interactions.
- Originally reported by Sir George Stokes in 1852, the fluorescence phenomena has developed into a fundamental instrument for quantitative and qualitative research in several fields of science.
The Electronic Excited State
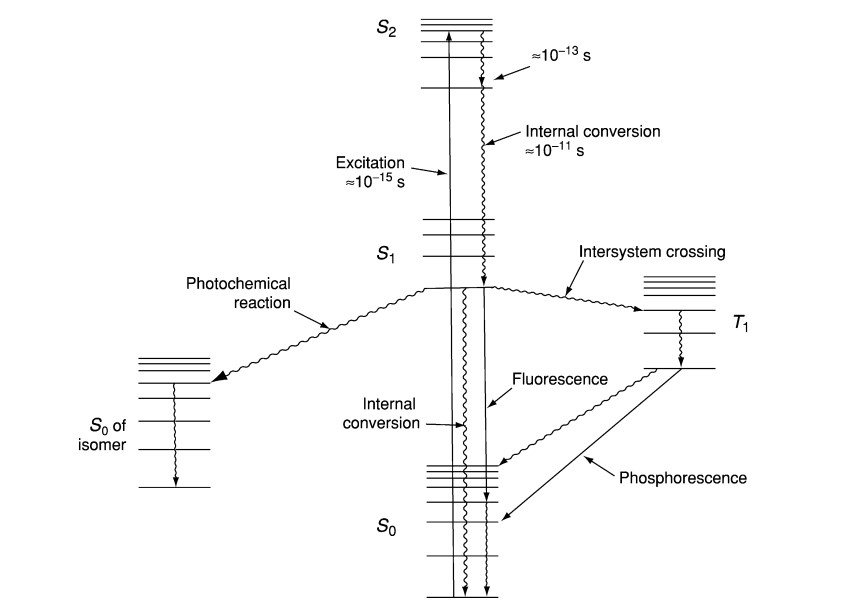
- In the field of fluorescence and phosphorescence processes, a basic idea is the electronic excited state. Involving the emission of photons, these mechanisms are essentially related with the relaxing of molecules from their excited electronic states to their ground states. Particularly relevant to polyatomic luminous substances, sometimes known as fluorophores, this phenomena results from transitions between electronic and vibrational states.
- The Jablonski diagram is a useful graphical aid to clarify the structural features of the excited state and the related transitions. Usually in this picture the energy variations between electronic states fall between 10,000 and 1 cm. With an energy gap between vibrational levels of around 100 to 1 cm, each electronic state additionally comprises of sublevels corresponding to the vibrational modes of the molecule.
- Crucially, photons with energy lying within the UV to blue-green spectrum are necessary to initiate an electronic transition. This is so because the excited and ground electronic states have a significant energy gap much above thermal energy levels. Thermodynamic factors therefore control that molecules essentially exist in their electronic ground state.
- Based on their multiplicity, one may further classify the electrical excited states of polyatomic molecules. The Pauli exclusion principle and the indistinctibility of electrons determine that electronic wave functions show either symmetric or asymmetric spin states. Whereas the antisymmetric wave function, known as the singlet state, has a singular multiplicity, symmetric wave functions, often known as triplet states, have a multiplicity of three.
- Usually coupling states of the same multiplicity to the first order is optical transitions. From the lowest vibrational level of the electronic ground state, this optical transition drives molecules toward a vibrational level reachable in the electronic excited state. Rapid vibrational relaxation follows stimulation on a femtosecond to Picosecond period as both the ground and stimulated electronic states are singlets. This mechanism produces the Stoke shift, which explains the finding of larger wavelengths for fluorescence photons than for excitation light.
- On the order of nanoseconds, fluorescence lifetime is the length of time the fluorophore preserves the lowest vibrational level of the excited electronic state. When the singlet electronic excited states of the fluorophore fade to a suitable vibrational level in the electronic ground state, fluorescence emission results.
- Fluorescence’s absorption and emission spectra respectively offer information on the vibrational level structures of the ground and excited electronic states. According to the Frank-Condon principle, electronic transitions barely change vibrational levels, thereby producing a similarity between the vibrational level structures of the ground and excited electronic states. Absorption and emission spectra therefore commonly show mirror properties.
- Moreover, an electron has certain polarization characteristics in its excited state. The excitation dipole is the phenomena whereby fluorophoresis is preferentially triggered when light polarization corresponds with a certain chemical axis. Fluorescence photons then produced by the molecule show polarization matched with another molecular axis, sometimes referred to as the emission dipole. Usually not overlapping, these excitation and emission dipoles help to define the special properties of fluorescence events.
Operating Procedure of Fluorescence spectroscopy
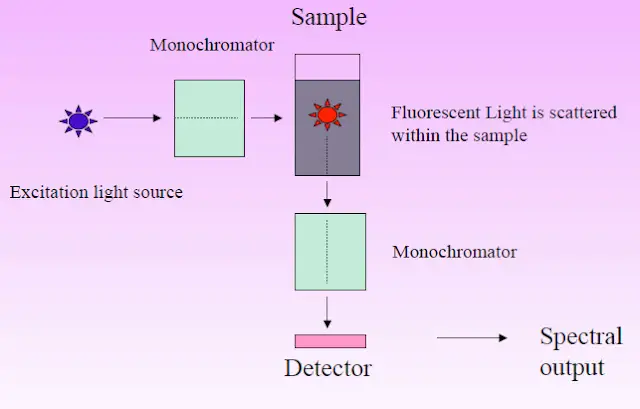
- Check that the manufacturer’s recommended calibration and warm-up settings for the fluorescence spectrometer match each other to guarantee the light source—such as a xenon lamp or laser—has reached a stable operational condition.
- Using a clean, premium quartz cuvette guarantees that the sample is free of particles and impurities. Diluting the fluorophore in a suitable solvent to an adequate concentration helps to prepare the sample.
- Rinse and, if needed, pre-clean the cuvette to remove any remaining molecules likely to cause quenching effects or background signals.
- To optimize the collecting of emitted fluorescence, slide the cuvette into the sample chamber of the instrument such that it is exactly aligned in the optical path.
- Using the excitation monochromator or suitable optical filter, set the excitation wavelength such that it matches the maximum sample absorption.
- Considering the average Stokes shift for the fluorophore, modify the emission monochromator or filter to encompass a variety of wavelengths including the predicted emission spectrum.
- Under same experimental circumstances, record a blank measurement using the pure solvent to capture background fluorescence and stray light contributions.
- Start the sample measurement and get the emission spectrum by letting the detector gather fluorescence data throughout the chosen wavelength range with a suitable integration time to maximize the signal-to—noise ratio.
- Document all experimental conditions—including instrument settings, sample preparation details, and environmental parameters—to ensure repeatability and enable additional analysis by subtracting the blank spectrum from the sample spectrum and analyzing the corrected emission spectrum to identify peak wavelengths, determine intensity values, and calculate pertinent parameters such quantum yield.
- Safely turn off the instrument, remove and clean the cuvette, and follow any operating handbook recommended routine maintenance to wrap off the process.
Types of luminescence
Luminescence refers to the emission of light by a substance not resulting from heat; instead, it occurs when electrons in a material absorb energy and then release it as light. This phenomenon encompasses various types, each characterized by the source of energy that initiates the light emission:
- Photoluminescence: Light emission caused by the absorption of photons. This category includes:
- Fluorescence: Emission of light that occurs almost instantaneously (within nanoseconds) after the absorption of photons. Common examples include fluorescent dyes and certain minerals.
- Phosphorescence: Similar to fluorescence, but with a delayed re-emission of light, lasting from microseconds to several minutes or even hours. Glow-in-the-dark materials exhibit phosphorescence.
- Chemiluminescence: Light produced as a result of a chemical reaction without the involvement of heat. Glow sticks are a familiar example, where mixing chemicals produces light.
- Bioluminescence: A form of chemiluminescence occurring in living organisms, such as fireflies and certain marine species, where biochemical reactions produce light.
- Electroluminescence: Light emitted in response to an electric current or a strong electric field. Light-emitting diodes (LEDs) operate based on this principle.
- Triboluminescence: Light generated when chemical bonds in a material are broken due to mechanical action like scratching, crushing, or rubbing. Some crystals emit light when fractured.
- Thermoluminescence: Emission of light when a substance that has previously absorbed energy from radiation is heated. This property is utilized in archaeological dating techniques.
- Radioluminescence: Light produced when a material is exposed to ionizing radiation. Historically, radium dials on watches used this phenomenon to glow in the dark.
- Sonoluminescence: Emission of short bursts of light from imploding bubbles in a liquid when excited by sound. This phenomenon is observed in certain experimental conditions.
What is a Fluorescence Spectrum?
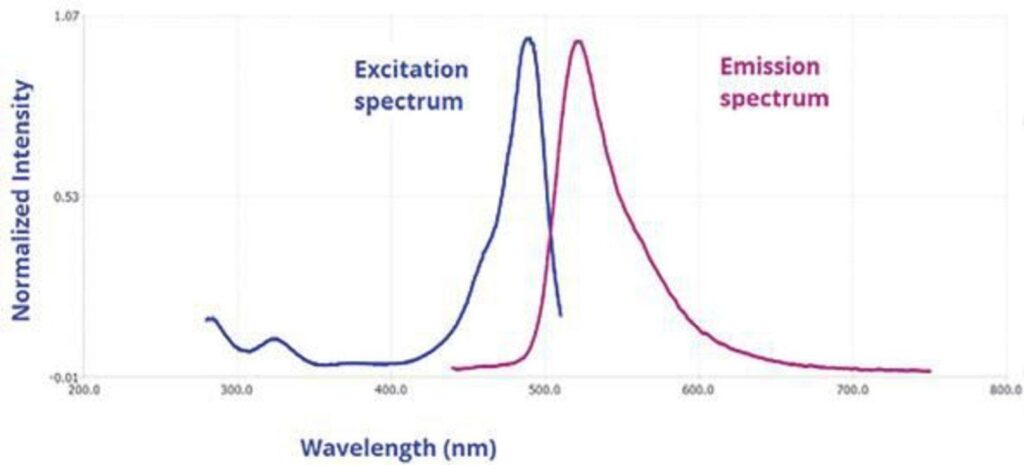
- After a molecule absorbs light, a fluorescence spectrum shows the dispersion of the intensities of emitted light over several wavelengths.
- It is generated when a substance absorbs energy, raising electrons to higher energy levels, then these electrons descend to lower energy states by releasing light.
- Analyzing molecular characteristics depends on the Stokes shift, a phenomena wherein the spectrum usually shows a change to longer wavelengths than the absorbed light.
- For the identification and counting of chemical species, this analytical instrument is basic in disciplines like analytical chemistry, biochemistry, and material science.
- Early findings by scientists such as Sir George Stokes, who recorded the behavior of fluorescent compounds in the 19th century, started the research of fluorescence.
- By means of thorough study of fluorescence spectra, scientists may deduce electronic transitions, molecule interactions, and environmental influences on molecular behavior.
- Fluorescent measurement precision and resolution have been greatly improved by developments in apparatus including monochromators, sensitive detectors, monochromatic excitation sources, and optimized excitation sources.
- Time-resolved fluorescence spectroscopy and high-throughput screening are the subjects of recent studies described in prestigious academic publications, hence broadening the range of applicability in environmental monitoring and biological imaging.
- Optimizing measuring techniques and creating new fluorescent probes depend on an awareness of the impact of experimental circumstances like solvent polarity, temperature, and pH on the fluorescence spectrum.
- The thorough investigation offered by fluorescence spectra advances analytical techniques and sensor technologies, therefore benefiting both basic research and useful applications.

Instrumentation of fluorescence spectroscopy
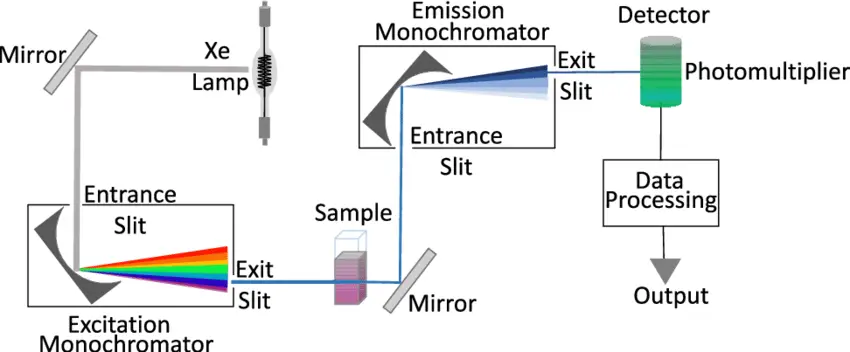
Fluorescence spectroscopy is a powerful analytical technique used to study the properties of molecules and detect specific substances in various applications. To perform fluorescence spectroscopy effectively, specialized instrumentation is required. This section discusses the key components and considerations involved in fluorescence spectroscopy instrumentation.
Components of Fluorescence Spectroscopy Instrumentation
- Light Sources:
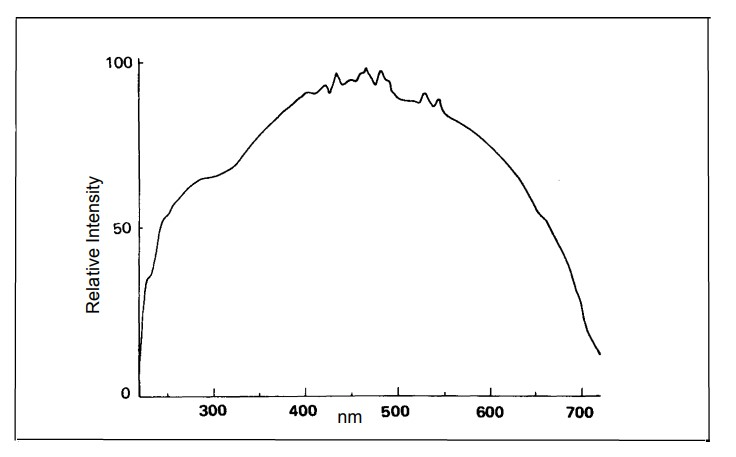
- Fluorescence instruments require a suitable light source capable of generating excitation light. Various light sources can be employed, including gas discharge lamps (e.g., mercury vapor lamps), light-emitting diodes (LEDs), and lasers.
- Lasers are particularly powerful as they can provide narrow-band excitation at a wide range of wavelengths, including the ultraviolet region.
- The choice of light source depends on the specific application and the spectral range of interest.
- Photodetectors:
- Photodetectors are essential for capturing the emitted fluorescence from the sample.
- Common photodetectors include photodiodes and photomultiplier tubes (PMTs). PMTs are often preferred for their high sensitivity and fast response times, making them suitable for fluorescence lifetime measurements.
- The selection of photodetectors depends on the desired sensitivity and the nature of the fluorescence signal.
- Wavelength Selection:
- Fluorescence spectroscopy requires precise wavelength selection to isolate specific excitation and emission wavelengths.
- In basic filter fluorimeters, filters are used to select the desired wavelengths. More advanced instruments employ monochromators to provide flexibility in wavelength selection.
- Monochromators allow for the measurement of both excitation and emission spectra, enhancing the analytical capabilities of the instrument.
- Read-Out Devices:
- The output from the photodetector is typically amplified and displayed on a readout device.
- Digital displays are common for their clarity and precision. Microprocessor-based electronics can further enhance data processing and compatibility with external devices such as printers and computers.
- Continuous sensitivity adjustment in the amplifier allows for concentration measurements across a wide range.
- Sample Holders:
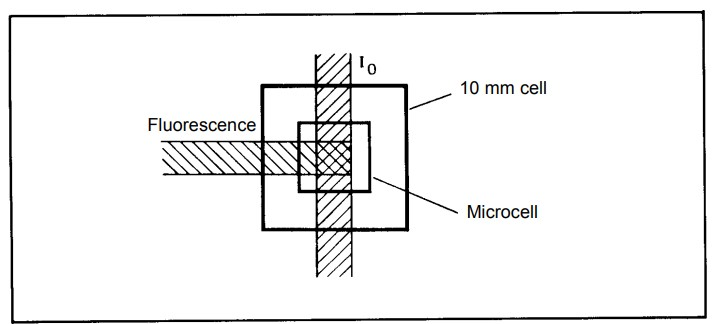
- Most fluorescence experiments are conducted in solution, and samples are held in cuvettes or flow cells.
- Cuvettes come in various shapes (circular, square, rectangular) and are made of materials that transmit both excitation and emission light.
- The choice of cuvette shape depends on factors such as pathlength and optical considerations.
- Different cuvette orientations (e.g., right-angled, front surface) can be used depending on the nature of the sample and the desired measurements.
- For highly concentrated samples, proper dilution is essential to prevent quenching of fluorescence.
Considerations in Fluorescence Spectroscopy Instrumentation:
- Sensitivity: The sensitivity of the instrument, including the choice of light source and photodetector, should match the requirements of the application. High sensitivity is crucial for detecting low-concentration analytes.
- Resolution: The instrument’s resolution, determined by factors such as the slit width of monochromators, affects its ability to distinguish closely spaced spectral features. High resolution may be required for certain applications.
- Light Source Stability: The stability of the light source is critical for obtaining reliable and reproducible results. Light source output fluctuations can be monitored and corrected using additional photodetectors.
- Sample Preparation: Proper sample preparation, including dilution when necessary, is essential to ensure accurate measurements and prevent sample-related artifacts.
- Data Processing: Advanced instrumentation may include features for data processing, such as integration techniques, to improve precision and reduce noise in fluorescence measurements.
Factors that affect fluorescence spectroscopy
- Molecular rigidity: Fluorescence spectroscopy uses rigid fluorophores because they have less vibrations and a lower triplet state probability. Phenolphthalein is flexible and non-fluorescent, unlike fluorescein and eosin.
- Solvent polarity: Fluorescence is also affected by solvent polarity. Heavy atoms in the solution can reduce structural fluorescence.
- Dissolved oxygen: Oxygen in the solution can also inhibit fluorescence emission. Fluorophore can do this by photochemical oxidation. Oxygen’s paramagnetic properties can extinguish fluorescence.
- pH: Fluorescence is affected by pH. For instance, aniline is a cation at low pH and an anion at high pH. Fluorescence disappears in both cases.
- Quenching: Fluorescence intensity decreases during quenching. Fluorescence or the fluorescent material may be absorbed by the solution. This is self-quenching.
- Conjugation: To absorb UV/vis rays, molecules must be unsaturated (have π electrons). Without radiation absorption, fluorescence cannot occur.
- Flexibility: Flexible structures emit less fluorescence than rigid ones.
- Types of substituents: Fluorescence is increased by electron-donating groups like amino and hydroxyl. Electron-withdrawing Nitro and carboxyl groups reduce fluorescence. Groups like SO3H and NH4+ do not impact fluorescence intensity.
- Temperature effect: Higher temperatures increase molecular collisions and decrease fluorescence intensity, whereas lower temperatures decrease collisions and increase fluorescence intensity.
- Viscosity: Increasing viscosity lowers molecular collisions, which raises fluorescence intensity, whereas reducing it increases them.
Applications of fluorescence spectroscopy
- Key uses include biomedical diagnostics and imaging as fluorescence spectroscopy allows the early illness diagnosis and real-time imaging in live tissues by means of high sensitivity and selective detection of certain biomolecules.
- Using fluorescence spectroscopy, environmental monitoring detects and quantifies contaminants like polycyclic aromatic hydrocarbons, herbicides, and heavy metals in water and soil, therefore providing fast and on-site analysis with little sample preparation.
- Using fluorescence spectroscopy to evaluate drug-target interactions, track biochemical events, and enable high-throughput screening tests accelerating the identification of potential compounds, pharmaceutical research aims at drug discovery and development.
- Fluorescence spectroscopy is used in materials science and nanotechnology to define new materials including quantum dots, polymers, and nanostructures, thereby guiding the design and optimization of sophisticated optical and electrical devices.
- Applications of food quality and safety evaluation help to manage quality by means of the identification of pollutants and validation of food authenticity by means of certain fluorescent markers, therefore guaranteeing compliance with safety criteria.
- Fluorescence spectroscopy helps forensic science by means of sensitive detection of trace evidence—body fluids and residues—which improves crime scene investigation and promotes the correct validation of forensic evidence.
Advantages of fluorescence spectroscopy
- Because of their high fluorescence quantum yield and effective photon counting, high sensitivity lets one identify trace levels of analytes, hence enabling analysis even at extremely low concentrations.
- Using fluorescent markers or inherent molecular fluorescence helps to achieve great specificity, therefore enabling selective identification in complicated sample matrices.
- Fluorescent spectroscopy is perfect for examining fragile biological specimens and expensive materials as non-destructive analysis guarantees that samples stay whole during measurement.
- Dynamic research of quick biochemical processes and environmental changes without major delay are made possible by rapid reaction and real-time monitoring features.
- Reduced requirement for intensive processing resulting from little sample preparation helps to minimize possible mistakes and maintain the analyte’s natural condition.
- Versatility in application across several disciplines—including materials science, environmental monitoring, and biological diagnostics—demonstrates its general usefulness in both research and industry contexts.
- Capability for both quantitative and qualitative analysis helps to precisely estimate analyte concentrations and permit thorough characterizing of molecular structures.
- By measuring fluorescence lifetimes, advanced methods include time-resolved fluorescence spectroscopy offer insights into molecular dynamics and interactions, therefore giving analytical data depth.
Limitations of fluorescence spectroscopy
- Limited application to non-fluorescent materials calls for either chemical labeling or intrinsic fluorescence, which could cause artifacts and complicate analysis.
- Sample’s susceptibility to background interference In complicated matrices, autofluorescence can lower sensitivity and complicate proper detection.
- Many times, signal quenching—including inner filter effects and concentration quenching—results in reduced fluorescence intensity and loss of quantitative precision.
- Under either continuous measurement or high excitation, photobleaching of fluorophores under restricts long-term monitoring of dynamic systems.
- Fluorescence characteristics may be greatly changed by environmental variables like pH, temperature, and solvent polarity, therefore affecting repeatability and necessitating rigorous control of experimental conditions.
- In multi-component systems, overlapping emission spectra hamper spectral deconvolution and need for sophisticated data processing methods for correct interpretation.
- Some study environments find the expense of apparatus, particularly specialized detectors and light sources, to be expensive and limits access.
- Variations in quantum yield and detector sensitivity create calibration problems that need for strict standardizing procedures to guarantee accurate quantitative analysis.
Precautions
- Filtering and cleaning samples can help you to guarantee appropriate sample preparation by removing contaminants that could lead to false positives or background fluorescence.
- To prevent signal quenching and inner filter effects, which might distort the actual fluorescence intensity and impact quantitative analysis, maximize sample concentration.
- To reduce spectral output variability and improve repeatability, keep under control environmental variables including steady pH, temperature, and solvent composition.
- Use established reference materials to routinely calibrate and validate instruments, therefore accounting for instrument drift and guaranteeing consistent measuring accuracy.
- Reduce high-intensity excitation source exposure to avoid photobleaching of fluorophores, therefore maintaining the integrity of the fluorescent signal across extended measurements.
- Using suitable optical filters and monochromators will help to minimise background interference and spectrum overlap, hence improving the resolution and specificity of the observed signals.
- Verify that fluorescent probes chosen and compatible with the sample matrix do not change the inherent characteristics of the analytes under study.
- When handling chemicals and biological materials, follow rigorous laboratory safety procedures to avoid contamination and protect operator health as well as sample integrity.
Quiz
Question 1: What is the fundamental principle of fluorescence spectroscopy?
A) Absorption of photons by a sample
B) Emission of photons by a sample
C) Scattering of photons by a sample
D) Reflection of photons by a sample
Question 2: In fluorescence spectroscopy, which of the following processes occurs when a molecule returns to its ground state after being excited?
A) Absorption
B) Emission
C) Scattering
D) Reflection
Question 3: What is the name of the wavelength of light that is used to excite a molecule in fluorescence spectroscopy?
A) Excitation wavelength
B) Absorption wavelength
C) Emission wavelength
D) Scattering wavelength
Question 4: Which component of a fluorescence instrument is responsible for selecting the wavelength of stimulation in fluorescence spectroscopy?
A) Detector
B) Sample holder
C) Excitation monochromator
D) Emission monochromator
Question 5: What is the term for the phenomenon in fluorescence spectroscopy where emitted light has a longer wavelength than the excitation light?
A) Fluorescence shift
B) Wavelength inversion
C) Absorption reversal
D) Stokes shift
Question 6: Which type of luminescence is similar to fluorescence but has a longer-lived excited state?
A) Absorption
B) Phosphorescence
C) Reflection
D) Scattering
Question 7: In fluorescence spectroscopy, what is the name of the device used to measure the intensity of emitted light?
A) Excitation monochromator
B) Sample holder
C) Detector
D) Emission monochromator
Question 8: What is the primary purpose of using a monochromator in fluorescence spectroscopy?
A) To select the sample holder
B) To select the emission wavelength
C) To select the excitation wavelength
D) To measure the intensity of emitted light
Question 9: Which of the following industries commonly uses fluorescence spectroscopy for applications such as DNA measurement?
A) Aerospace
B) Automotive
C) Bioscience
D) Construction
Question 10: What precaution should be taken to minimize contamination in fluorescence analysis when using stoppers or cork?
A) Use rubber or cork stoppers
B) Rinse with water before use
C) Avoid using stoppers altogether
D) Use inert materials like Teflon or glass
FAQ
What is Fluorescence Spectrophotometry?
Fluorescence Spectrophotometry is a technique used to measure the intensity of light emitted by a substance when it is excited by a specific wavelength of light.
What is the principle of Fluorescence Spectrophotometry?
The principle of Fluorescence Spectrophotometry is based on the ability of certain molecules to absorb light at one wavelength and re-emit it at a longer wavelength.
What are the key parts of a Fluorescence Spectrophotometer?
The key parts of a Fluorescence Spectrophotometer include a light source, a monochromator, a sample holder, a detector, and a readout device.
What are the advantages of Fluorescence Spectrophotometry?
Some of the advantages of Fluorescence Spectrophotometry include high sensitivity, high selectivity, and the ability to measure very small amounts of a substance.
What are some common uses of Fluorescence Spectrophotometry?
Common uses of Fluorescence Spectrophotometry include studying the structure of proteins and nucleic acids, monitoring chemical reactions, and measuring the concentration of analytes in a sample.
What is the difference between Fluorescence Spectrophotometry and Absorption Spectrophotometry?
Fluorescence Spectrophotometry measures the light emitted by a substance after it has been excited by a specific wavelength of light, while Absorption Spectrophotometry measures the amount of light absorbed by a substance.
Is Fluorescence Spectrophotometry harmful to the environment?
Fluorescence Spectrophotometry is not harmful to the environment as it uses small amounts of energy and does not produce any harmful by-products.
How is Fluorescence Spectrophotometry used in medical research?
Fluorescence Spectrophotometry is used in medical research to study the structure and function of proteins and nucleic acids, and to monitor the effectiveness of drugs and other treatments.
What are the most common Fluorescence Spectrophotometry instruments?
The most common Fluorescence Spectrophotometry instruments include Fluorometers, Fluorimeters, and Fluorescence Microscopes.
Can Fluorescence Spectrophotometry be used to measure the concentration of analytes in real-time?
Yes, Fluorescence Spectrophotometry can be used to measure the concentration of analytes in real-time, making it a useful tool for monitoring chemical reactions and other processes.
- Itagaki, H. (2000). Fluorescence Spectroscopy. Experimental Methods in Polymer Science, 155–260. doi:10.1016/b978-0-08-050612-8.50009-x
- Hill, S. J., & Fisher, A. S. (1999). Atomic Fluorescence, Methods and Instrumentation. Encyclopedia of Spectroscopy and Spectrometry, 50–55. doi:10.1006/rwsp.2000.0010
- Butcher, D. J. (2005). ATOMIC FLUORESCENCE SPECTROMETRY. Encyclopedia of Analytical Science, 221–228. doi:10.1016/b0-12-369397-7/00034-0
- Senesi, N., & D’Orazio, V. (2005). FLUORESCENCE SPECTROSCOPY. Encyclopedia of Soils in the Environment, 35–52. doi:10.1016/b0-12-348530-4/00211-3
- Gmes, Anderson & Lunardi, Claure & Rocha, Fellipy & Patience, Gregory. (2019). Experimental Methods in Chemical Engineering: Fluorescence Emission Spectroscopy. The Canadian Journal of Chemical Engineering. 97. 10.1002/cjce.23506.
- https://core.ac.uk/download/pdf/335060282.pdf
- https://www.news-medical.net/life-sciences/What-is-Fluorescence-Spectroscopy.aspx
- https://www.rp-photonics.com/fluorescence_spectroscopy.html
- https://www.slideshare.net/HariSharanMakaju/fluorescence-spectrometry
- https://www.agilent.com/en/product/molecular-spectroscopy/fluorescencespectroscopy/applications-of-fluorescence-spectroscopy
- http://www.jchps.com/specialissues/Specialissue5/05jchpssi5knaresh18-21.pdf
- https://www.emsl.pnnl.gov/science/related-instrument/fluorescence-spectroscopy/1671
- https://conductscience.com/fluorescence-spectrophotometry-principles-and-applications/
- http://web.mit.edu/solab/Documents/Assets/So-Fluorescencespectrophotometry.pdf
- https://www.horiba.com/sgp/scientific/technologies/fluorescence-spectroscopy/what-is-fluorescence-spectroscopy/
- https://jascoinc.com/learning-center/theory/spectroscopy/fluorescence-spectroscopy/
- https://pubs.acs.org/doi/10.1021/ar900291y
- http://www.chromedia.org/chromedia?waxtrapp=mkqjtbEsHiemBpdmBlIEcCDpB&subNav=cczbdbEsHiemBpdmBlIEcCDpBP
- https://www.chem.uci.edu/~dmitryf/manuals/Fundamentals/FluorescenceSpectroscopy.pdf
- Text Highlighting: Select any text in the post content to highlight it
- Text Annotation: Select text and add comments with annotations
- Comment Management: Edit or delete your own comments
- Highlight Management: Remove your own highlights
How to use: Simply select any text in the post content above, and you'll see annotation options. Login here or create an account to get started.