Fluorescence Spectroscopy is an analytical method that studies the fluorescence emitted by a sample when it is excited by light (often UV or visible).
- It is often called fluorimetry or spectrofluorometry.
- In practice, light of a defined excitation wavelength is shone on sample, electrons are raised to excited states.
- Then molecules relax and emit light at longer emission wavelength (lower energy).
- A spectrofluorometer or similar instrument is used to measure excitation and emission spectra.
- The quantum yield (ratio of photons emitted / photons absorbed) is used to describe efficiency.
- Lifetimes (decay time) can be measured by time-domain or frequency-domain methods.
- Fluorescence spectroscopy complements absorption spectroscopy; often better sensitivity.
- Very high sensitivity is offered by this method, low concentrations (even trace) can be detected.
- Selectivity is allowed because excitation and emission wavelengths differ (Stokes shift), so interference is reduced.
- It is widely used in chemistry, biology, medicine to monitor molecules, reactions, binding, structural changes.
- Kinetic and dynamic information (e.g. lifetimes) can be extracted.
- Fluorescence phenomenon was observed long before understood (e.g. in the 1500’s, lignum nephriticum wood blue glow).
- In 1845, Herschel discovered that UV light can excite a quinine solution to emit blue light.
- Sir George G. Stokes coined “fluorescence” in 1852, and described the shift to longer wavelength (emission).
- In early 20th century, first fluorescence microscopes were built (1911–1913) by Otto Heimstaedt & Heinrich Lehmann.
- Later, Gregorio Weber pioneered many modern uses in biology (protein fluorescence, probes).
- Theoretical model of excited / ground state transitions via Jablonski diagram was formulated by Aleksander Jablonski (mid-20th century).
Principle of Fluorescence Spectroscopy
- Fluorescence spectroscopy based on the principle that certain molecules absorb light energy and then emit part of it as visible radiation when returning to lower energy state.
- When a photon of appropriate wavelength falls on a molecule, its electron is excited from ground state (S₀) to higher excited singlet state (S₁ or S₂).
- The excitation occur very fast, within about 10⁻¹⁵ seconds, and electrons move to higher molecular orbital having more energy.
- After excitation, part of absorbed energy is lost by vibrational relaxation and internal conversion, so the molecule goes to the lowest vibrational level of excited singlet state.
- From this state, it returns back to the ground state by emission of light known as fluorescence.
- The emitted photon always have less energy (thus longer wavelength) than absorbed light, because some energy is dissipated as heat – this difference termed as Stokes shift.
- The intensity of fluorescence emission is directly proportional to concentration of fluorophore within certain limit, beyond which quenching occurs.
- The whole process involve electronic transitions, and the spectrum obtained gives information about electronic structure and environment of molecule.
- Excitation and emission both can be recorded by spectrofluorometer, where monochromators select specific wavelengths for analysis.
- In most compounds fluorescence emission occur in nanosecond range, while delayed emissions (phosphorescence) happen in microsecond to second range.
- The efficiency of fluorescence process expressed as quantum yield (Φf), which represent ratio of emitted photons to absorbed photons.
- Fluorescence process is mostly shown by molecules having rigid and planar structures with conjugated π-system like anthracene, fluorescein, rhodamine, etc.
- In general, the mechanism involve 3 main stages – (i) Excitation by light absorption, (ii) Relaxation by non-radiative losses, and (iii) Emission of fluorescent light.
- Fluorescence spectroscopy therefore depends on energy transition between singlet states, and is widely used for molecular identification and microenvironmental analysis.
Applications of Fluorescence Spectroscopy in inorganic chemistry
- Fluorescence spectroscopy is used widely for studying molecular structure and conformational change of organic compounds which have aromatic or conjugated systems.
- It is applied for identification of functional groups that are responsible for emission behavior in organic molecules, especially in aromatic hydrocarbons.
- The purity of organic compounds can checked by fluorescence intensity variation, since even small impurity can quench or enhance emission strongly.
- In photochemical reactions, fluorescence spectroscopy is used to monitor intermediate formation and decay rate which happen during light-induced transformations.
- The method is useful for measuring quantum yield, fluorescence lifetime and excited state energy which help to understand reaction mechanism.
- In polymer chemistry, it is used to investigate polymerization process, molecular aggregation and excimer/exciplex formation in organic materials.
- The electronic transitions within conjugated π-systems are analyzed by fluorescence spectra which shows shifts depending on solvent polarity or substitution pattern.
- It has been applied for detection of organic pollutants, like polycyclic aromatic hydrocarbons (PAH) in environmental samples.
- In biochemical field, many organic fluorophores (like fluorescein, rhodamine, dansyl chloride) are used as probes for tracing organic reactions or biological molecules.
- The energy transfer between donor–acceptor pairs in organic compounds are studied using fluorescence resonance energy transfer (FRET) technique.
- Fluorescence spectroscopy is employed for studying reaction kinetics, particularly in reactions involving excited state or radical intermediates.
- It is also applied in designing organic light-emitting diodes (OLEDs), where fluorescence efficiency of organic materials are examined.
- Many organic reactions which involve photo-oxidation or reduction are understood by comparing fluorescence quenching or enhancement behavior under different atmosphere.
- The method provides a non-destructive, sensitive, and accurate approach for analyzing organic compounds in solution / solid state etc.
Special fluorimetric applications
- Fluorescence Quenching Studies – are used to determine molecular interaction between fluorophore and quencher molecule which may be static or dynamic in nature.
- The quenching mechanism can analyze by observing change in fluorescence intensity or lifetime that occurs when quencher interacts with excited molecule.
- Fluorescence Lifetime Measurement is applied for studying excited state decay processes, which give valuable info about environment around fluorophore molecule.
- The lifetime values often depend by solvent polarity, temperature or binding of analyte, which indicate microenvironmental changes.
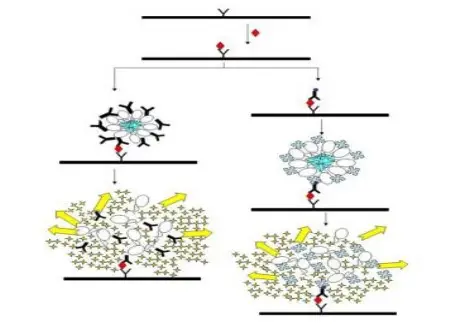
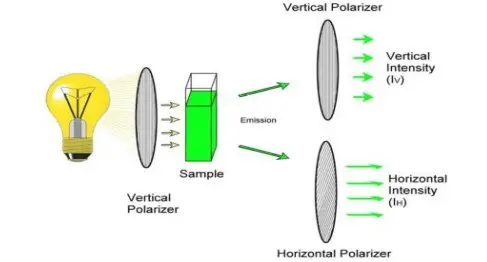
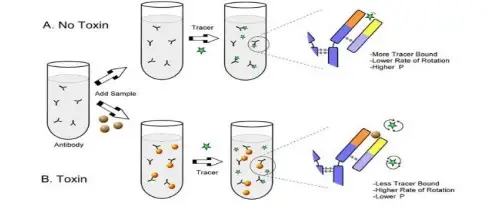
- Fluorescence Polarization (FP) is used for determining rotational diffusion and molecular size in solution, larger molecules show higher polarization values.
- It is applied in binding studies where changes in polarization indicate formation of complex between small and large molecules.
- Fluorescence Resonance Energy Transfer (FRET) technique is used for measuring distance between two chromophores (donor–acceptor), usually in 10–100 Å range.
- FRET is highly sensitive to spatial changes, so it’s applied to study protein folding / conformational transition and biological macromolecule interaction.
- Synchronous Fluorescence Spectroscopy (SFS) is used for mixture analysis where simultaneous scanning of excitation and emission wavelength improve resolution of spectra.
- It helps in determination of overlapping fluorescent species like aromatic hydrocarbons in complex samples.
- Time-Resolved Fluorescence Spectroscopy allows observation of transient excited state processes, to study reaction kinetics and photophysical behavior.
- Anisotropy Measurement (also termed as polarization anisotropy) is applied for studying rotational motion, viscosity and molecular binding in various media.
- Front-face fluorescence technique is used for solid or turbid samples where normal right-angle geometry fails due to scattering or absorption effects.
- Phase-modulation fluorimetry is employed for high frequency modulation study to determine lifetime and phase shift parameters precisely.
- In single molecule fluorescence, detection of individual fluorophores is done to analyze molecular heterogeneity and dynamic fluctuation which are averaged out in bulk.
- Quantum yield determination is an important special application for comparing efficiency of fluorescence emission among different compounds.
- Such methods are used broadly in biochemistry, material science, environmental analysis and in design of optical sensors etc.
- These fluorimetric techniques provide deeper insight into molecular interactions and microenvironment, though careful calibration and control are usually required for accurate result.


Reference
- Libretexts. (2022, August 28). 1.11: Fluorescence spectroscopy. Chemistry LibreTexts. https://chem.libretexts.org/Bookshelves/Analytical_Chemistry/Physical_Methods_in_Chemistry_and_Nano_Science_%28Barron%29/01%3A_Elemental_Analysis/1.11%3A_Fluorescence_Spectroscopy
- PerkinElmer Ltd. (n.d.). An introduction to fluorescence spectroscopy. https://www.chem.uci.edu/~dmitryf/manuals/Fundamentals/Fluorescence%20Spectroscopy.pdf
- Wilson, M. (2017, November 15). The fundamentals and history of fluorescence and quantum dots. Learn & Share | Leica Microsystems. https://www.leica-microsystems.com/science-lab/life-science/the-fundamentals-and-history-of-fluorescence-and-quantum-dots/
- ZEISS Microscopy Online Campus | Microscopy Basics | Fluorescence Microscopy. (n.d.). https://zeiss-campus.magnet.fsu.edu/articles/basics/fluorescence.html
- News-Medical. (2018, November 21). The history of fluorescence microscopy. https://www.news-medical.net/life-sciences/The-History-of-Fluorescence-Microscopy.aspx
- Povrozin, Y., & Barbieri, B. (2016). Fluorescence spectroscopy. In Myer Kurtz (Ed.), Handbook of Measurement in Science and Engineering (Vol. 3). John Wiley & Sons. https://iss.com/media/Fluorescence_Spectroscopy.pdf
- Barbieri, B., Prof. David Jameson, Nicolás Monardes, Charles de L’Écluse, Galileo Galilei, Vincenzo Casciarolo, Robert Boyle, David Brewster, John Herschel, Edmond Becquerel, George Gabriel Stokes, E. Nichols, E. Merrit, Stern, Volmer, S.J. Vavilov, F. Perrin, E. Gaviola, A. Jablonski, . . . F. Goppelsröder. (n.d.). A short history of fluorescence. https://diverdi.colostate.edu/C372/experiments/steady%20state%20fluorescence%20of%20quinine%20and%20quenching%20by%20chloride/references/short%20history%20of%20fluorescence.pdf
- Wikipedia contributors. (2025, September 16). Fluorescence spectroscopy. Wikipedia. https://en.wikipedia.org/wiki/Fluorescence_spectroscopy
- Settele, S., Schrage, C. A., Jung, S., Michel, E., Li, H., Flavel, B. S., Hashmi, A. S. K., Kruss, S., & Zaumseil, J. (2024). Ratiometric fluorescent sensing of pyrophosphate with sp3-functionalized single-walled carbon nanotubes. Nature Communications, 15(1). https://doi.org/10.1038/s41467-024-45052-1
- AZoM. (2024, February 16). Applications of advanced fluorescence spectroscopy. https://www.azom.com/article.aspx?ArticleID=13958
- Wikipedia contributors. (2025, May 8). Lanthanide probes. Wikipedia. https://en.wikipedia.org/wiki/Lanthanide_probes
- Text Highlighting: Select any text in the post content to highlight it
- Text Annotation: Select text and add comments with annotations
- Comment Management: Edit or delete your own comments
- Highlight Management: Remove your own highlights
How to use: Simply select any text in the post content above, and you'll see annotation options. Login here or create an account to get started.