Use Simpson’s index of diversity (D) to calculate the biodiversity of an area, and state the significance of different values of D (the formula for Simpson’s index of diversity will be provided, as shown in the Mathematical requirements)
Use Simpson’s index of diversity (D) to calculate the biodiversity of an area, and state the significance of different values of D (the formula for Simpson’s index of diversity will be provided, as shown in the Mathematical requirements)
Please login to submit an answer.
Simpson’s Index of Diversity (D) is a widely used measure to quantify biodiversity within a community by considering both the number of species and their relative abundances. Here’s how to calculate it, along with an explanation of the significance of different values.
Formula for Simpson’s Index of Diversity (D)
The formula for Simpson’s Index is given by:

Where:
- ni = the number of individuals of species ii
- N = the total number of individuals of all species
- ∑ = the summation symbol, indicating that you sum across all species present in the community.
Steps to Calculate Simpson’s Index
- Collect Data: Gather data on the number of individuals for each species in the area.
- Calculate Total Individuals (N): Sum all individuals across all species.
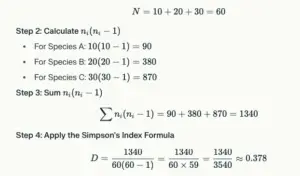
- Calculate ni(ni−1): For each species, calculate ni(ni−1) and sum these values.
- Apply the Formula: Substitute the summed values into the formula to calculate D.
Example Calculation
Suppose we have the following data for a community with three species:
| Species | Number of Individuals (nini) |
|---|---|
| Species A | 10 |
| Species B | 20 |
| Species C | 30 |
Step 1: Calculate Total Individuals (N)
Significance of Different Values of D
The value of Simpson’s Index (D) ranges from 0 to 1:

- D = 0: Represents infinite diversity, meaning there is an equal distribution of individuals among all species.
- D close to 1: Indicates low diversity, suggesting that a few species dominate the community. A value closer to zero indicates that one or a few species are very abundant compared to others.
To make interpretation easier, it is common to calculate Simpson’s Index of Diversity, which is given by:
In this case:
- A value close to 1 indicates high diversity.
- A value close to 0 indicates low diversity.
- Share on Facebook
- Share on Twitter
- Share on LinkedIn
Helpful: 0%


