What is NMR Spectroscopy (Nuclear Magnetic Resonance Spectroscopy)?
- NMR Spectroscopy refer as a analytical technique which used for determining structure of organic / inorganic molecules.
- In this method, interaction of atomic nuclei with applied magnetic field and radio frequency radiation are observed, which gives valuable information about molecular structure.
- The principle based on the absorption of electromagnetic radiation by nuclei which placed in strong magnetic field.
- When nuclei like ¹H, ¹³C, ¹⁹F etc. are placed in external magnetic field (B₀), they align either parallel or antiparallel to it, producing energy difference (ΔE) between states.
- By applying radiofrequency (rf) radiation, transition between these energy levels are induced, and this transition are measured as resonance signal.
- Each nuclei in molecule experience slightly different magnetic environment because of shielding or deshielding effects caused by surrounding electrons.
- These difference cause different resonance frequency, and hence a spectrum are obtained which shows peaks at characteristic positions.
- The position of peaks are expressed as chemical shift (δ) in parts per million (ppm), it represent electronic environment of nuclei.
- The spectrum also show splitting patterns (multiplets) due to spin-spin coupling between adjacent nuclei, which gives information about number of neighboring atoms.
- The intensity of peaks are proportional to number of equivalent nuclei, which help in quantitative analysis also.
- The most common types are ¹H-NMR and ¹³C-NMR, while others like ¹⁹F, ³¹P, etc. are also used for special purpose.
- Solvents used are generally deuterated (like CDCl₃, D₂O, etc.) to avoid interference from hydrogen signal.
- In NMR spectrometer, strong magnet (usually superconducting magnet) are used with field strength 300–900 MHz range.
- Sample are placed in thin glass tube, and data acquisition done by Fourier transform (FT) method which convert time domain signal into frequency domain spectrum.
- From the obtained spectrum, structure, purity, and even dynamic behavior of molecules are elucidated.
- It’s widely used by chemists, biochemists, pharmaceutical and material scientists for studying compound identification, conformations, and interactions etc.
- Although very powerful, NMR requires high cost instrument, skillful operation and relatively large amount of sample compared to other methods.
- In short, NMR spectroscopy is considered as one of the most precise / non-destructive tool for molecular structural elucidation.
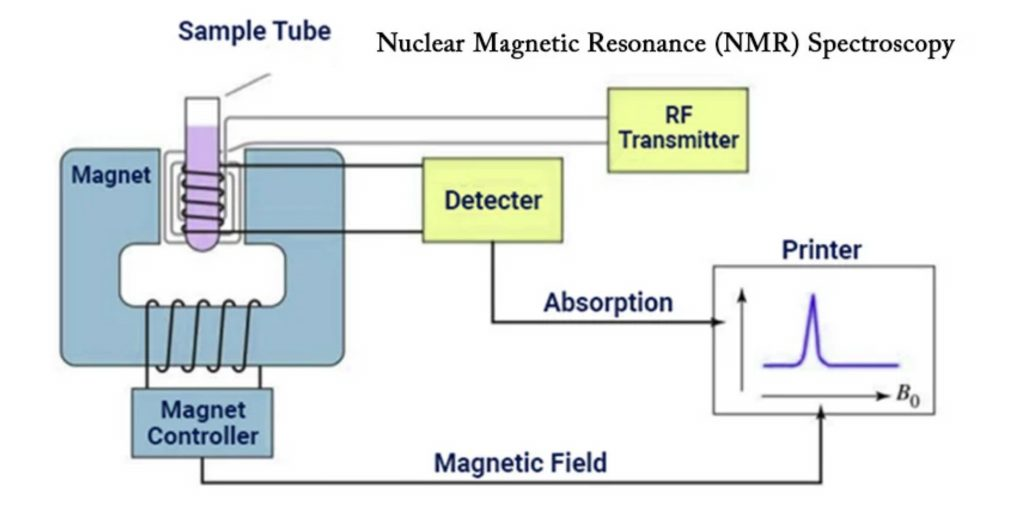
Principle of NMR Spectroscopy
- Many atomic nuclei with non-zero spin (I ≠ 0) act like tiny magnets because they have a magnetic moment, this is the starting thing.
- When those nuclei are placed in a strong external magnet field (B₀) a net magnetisation is induced and the nuclei align either with or against the field, it is what happens.
- The energy difference (ΔE) between spin-states arises because of the Zeeman effect (magnetic splitting) when the field is applied.
- Then a radio-frequency (rf) pulse is applied which causes some of the aligned nuclei to flip from lower energy state to higher energy state, this transition is induced actively.
- After the pulse the nuclei relax back to equilibrium and emit electromagnetic energy at the characteristic frequency — this emission is what is detected.
- That frequency or resonance depends on local electronic environment of the nucleus (shielding/deshielding) so chemical shift is generated, allowing us to “see” environment of nucleus.
- The magnitude of the resonance (intensity) relates to number of equivalent nuclei and the splitting of peaks (spin-spin coupling) gives info about neighbours of that nucleus.
- In practise the waveform (time domain) is recorded (free induction decay) then converted by Fourier transform into frequency domain spectrum which we interpret.
- Only nuclei with spin and non-zero magnetic moment are “NMR active” (like ¹H, ¹³C) many others (I =0) are invisible to NMR.
- The principle may be summarised in three steps: alignment/polarisation in B₀, perturbation by rf pulse, detection & analysis of emitted signals.
- The strength of magnet (field strength) and frequency of rf determine sensitivity and resolution, so higher field gives better separation of resonances.
- Relaxation phenomena (spin-lattice T₁, spin-spin T₂) are also part of principle because they affect signal decay and line-width, though often neglected in rudimentary explanation.
Working of Nuclear Magnetic Resonance (NMR) Spectroscopy
- A sample is placed inside strong and homogeneous magnet (B₀) so that the nuclear spins of NMR-active nuclei are aligned / partially aligned by the field.
- The nuclei (with spin ≠ 0) develop a net magnetization vector along the direction of the applied field, this net magnetization is what we manipulate.
- A short pulse of radio-frequency (RF) electromagnetic radiation is applied perpendicular to B₀, and the nuclei are excited from lower energy states to higher energy states (they flip or precess) by this RF pulse.
- After the RF pulse, the excited spins relax back toward equilibrium and in doing so they emit signals (electromagnetic) which are detected by receiver coils.
- The detected time-domain signal (called free induction decay, FID) is converted by Fourier Transform (FT) into a frequency-domain spectrum which shows peaks at resonant frequencies.
- The resonant frequencies (and their position/shape) depend on the chemical environment of each nucleus (shielding/deshielding by electrons) so each different environment gives slightly different resonance (chemical shift) and coupling.
- In practise many scans (repeated excitations & acquisitions) are done to improve signal-to-noise ratio, then the spectrum is analysed for chemical shift, multiplicity, intensity etc.
- Sample preparation (e.g., dissolving solid in solvent, often deuterated solvent) is done to ensure clarity of spectrum and avoid interfering signals.
- The working of NMR thus involves magnetisation alignment, RF excitation, signal detection, processing and interpretation.
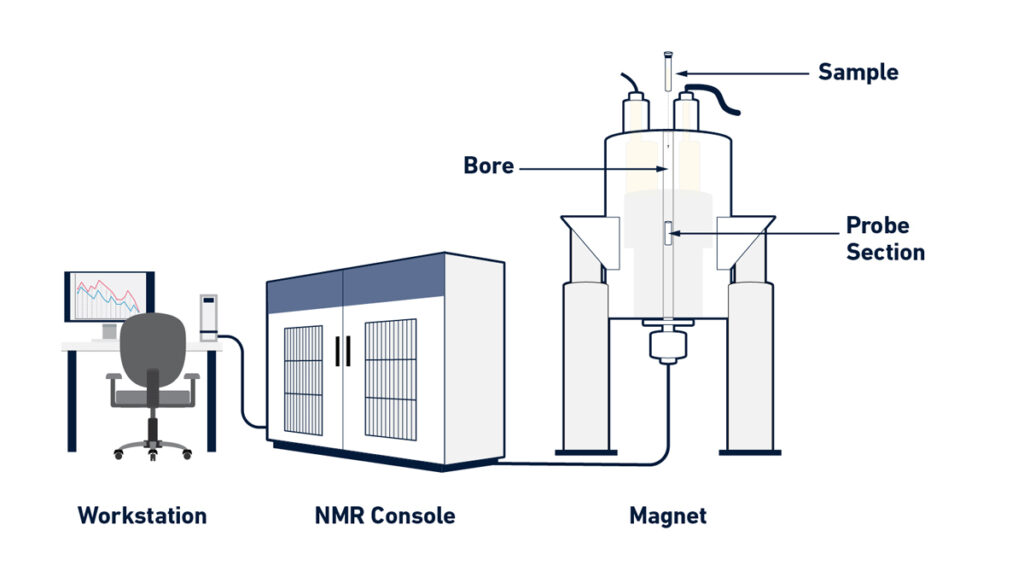
Instrumentation of Nuclear Magnetic Resonance (NMR) Spectroscopy
- The magnet – A strong and stable magnet is used to produce a homogeneous magnetic field (B₀) for the sample to align the nuclear spins.
- The probe (also called NMR probe) – The sample tube is placed into this part which houses the coils (rf transmitter/receiver) and sometimes field-gradients.
- The radio-frequency (RF) transmitter and receiver – An RF pulse is generated to excite the nuclei and then the emitted signal is picked up by the receiver coil.
- The console / spectrometer electronics – The console handles pulse generation, signal detection, timing, digitization and sometimes temperature/lock controls.
- The workstation / computer software – A computer interface is used for experiment control, data acquisition, processing (FT) and spectrum interpretation.
- The sample tube / sample holder – A glass tube (for solution NMR) that holds the sample, placed into the probe and magnet bore.
- The shim coils / field-homogeneity system – Additional coils or systems are used to adjust the magnetic field uniformity (homogeneity) which is critical for resolution; deviation causes line-broadening.
How to read an NMR spectrum and what it tells you?
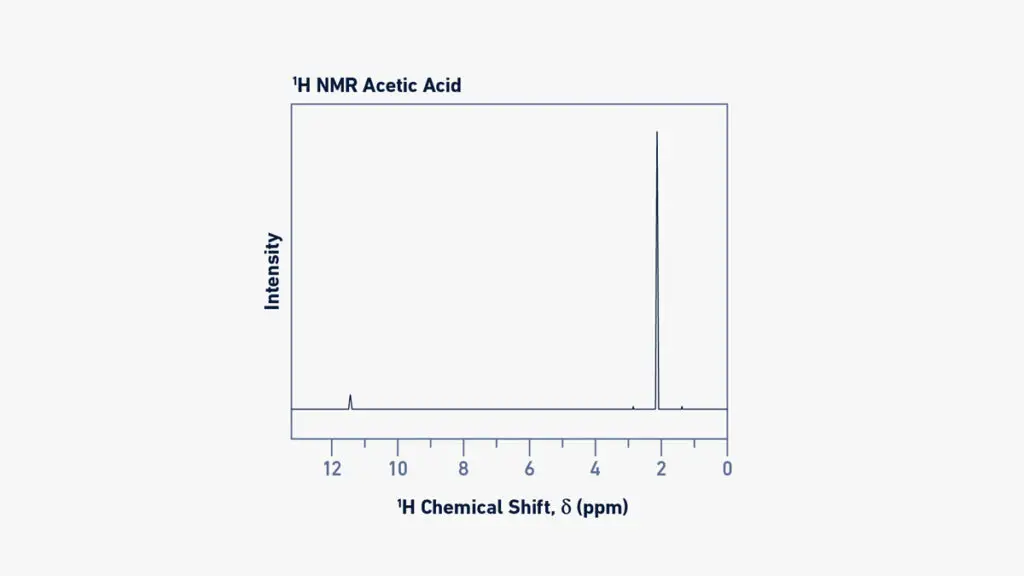
The horizontal axis (x-axis) of a ¹H or ¹³C spectrum is labelled in ppm (parts per million) and the position of each peak tells about the chemical environment of the nucleus.
A peak appearing further to the left (higher δ value) is said to be downfield and usually indicates that the nucleus is deshielded (less electron density) because of electronegative atoms or unsaturated groups nearby.
The integration (area under the signal) in a ¹H-NMR spectrum is proportional to the number of equivalent hydrogen atoms giving that signal, so you can tell how many H’s of that type are present.
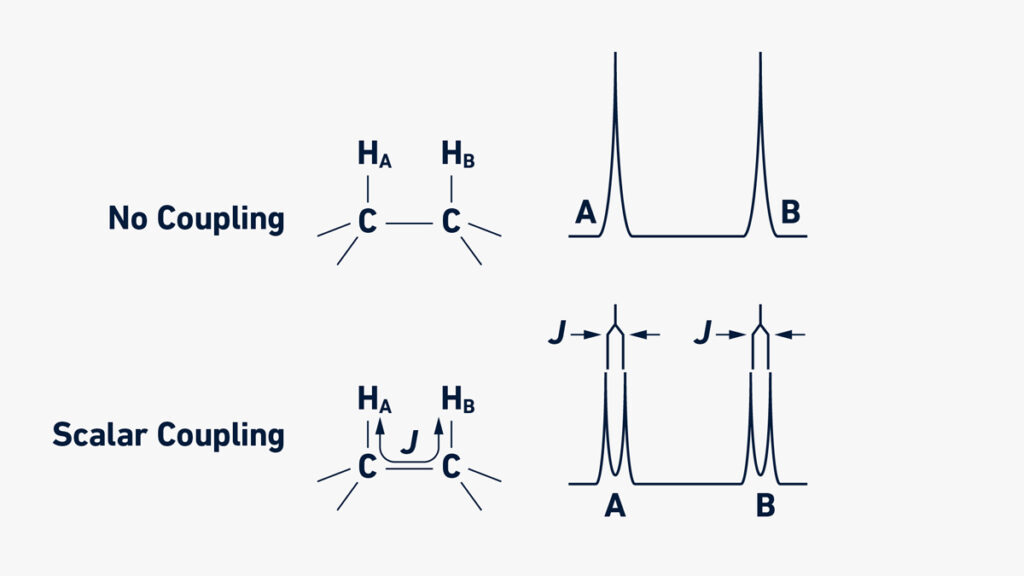
The multiplicity (splitting pattern) of a peak shows how many neighbouring non-equivalent H’s are coupling to that nucleus (in ¹H-NMR) by the rule (N +1) where N = number of neighbours.
Equivalence of nuclei is indicated by identical chemical shift & same splitting behaviour, so if two H’s give one signal then they are equivalent by symmetry or fast rotation.
From the combination of chemical shift, integration, and splitting you can infer what type of group the nucleus belongs to (methyl, methylene, aromatic H, aldehyde H etc.).
The number of distinct signals tells how many unique chemical environments are present for that nucleus type, so if you expect 3 types of H you’ll see approx 3 sets of peaks (provided good resolution).
The coupling constant (J-value in Hz) may indicate how the nuclei are connected (for example whether protons are geminal, vicinal or long-range) though this is more advanced.
For ¹³C-NMR the peaks are usually singlets (if proton decoupled) and you infer how many different carbon environments exist and their approximate type (sp3, sp2, carbonyl) from chemical shift tables.
What the spectrum tells you: the structure (or part of it) of molecule, how many of each type of nucleus, how they’re connected / neighbouring each other, presence of functional groups, symmetry, etc.
Applications of NMR Spectroscopy
- In organic & physical chemistry laboratories the technique is widely used to determine molecular structure, composition and purity of compounds.
- In pharmaceutical / drug-development field it is used for analysing small molecules, biologics and their interactions, so the drug design process is assisted.
- In food science the method is applied for quality‐control, for mapping proteins, amino acid profiles, lipid fractions, and water mobility in foods (meats, dairy, oils) etc.
- In metabolomics & bio-analysis the method is employed to detect biomarkers in bodily fluids and tissues, to study metabolism in health/ disease.
- In materials science / industrial monitoring the tool is used for process control, monitoring reaction kinetics, investigating polymers / ceramics and solids.
- In environmental science the technique finds use for detecting contaminants in soil / water, and monitoring chemical changes in ecosystems.
- In medical imaging are related techniques (for example Magnetic Resonance Imaging (MRI)) which derive from NMR principles, so medicine benefits indirectly.
Advanatges of NMR
- The method is non-destructive, meaning the sample remains intact and can be reused for further study.
- Minimal sample preparation is required, the sample often only needs dissolving in a deuterated solvent rather than lengthy processing.
- The technique gives rich structural information about molecules (3D arrangements, functional groups, interactions) in a new and fresh way.
- High reproducibility is offered, so results from one run can be reliably compared with another.
- The method is quantitative in many cases, the signal intensity (or area) correlates to number of nuclei, so composition can be deduced.
- It provides dynamic/interaction information and not just static pictures, so molecular motions, binding, diffusion can be studied.
- There is no ionizing radiation involved in NMR, so safety risk from radioactive exposure is avoided.
- The method is versatile and can be applied in many fields (chemistry, biology, materials, food science) so the technique is widely useful.
Limitations of NMR’s
- The sensitivity of NMR is rather low, so many samples must be present at high concentration (like mg amounts) in order for usable spectra to be acquired.
- Large and complex molecules (high molecular weight compounds) are difficult to resolve by NMR because peaks overlap and relaxation times shorten, making the spectra broad and messy.
- Only nuclei with non-zero spin (magnetic moment) are “NMR active”, so many elements (or isotopes) can’t be studied or give very weak signals.
- The instruments are expensive to purchase and maintain (strong magnets, cryogens, shielding) which means cost and infrastructure are high.
- Spectral interpretation can become very complex for mixtures or solid samples, making it time-consuming and requiring expert skill.
- The time required for data acquisition (especially for weaker signals or high resolution) is longer than many simpler methods.
- Magnetic field drift or poor homogeneity may reduce resolution and make peaks broadened or shifted.
Upfield vs downfield NMR
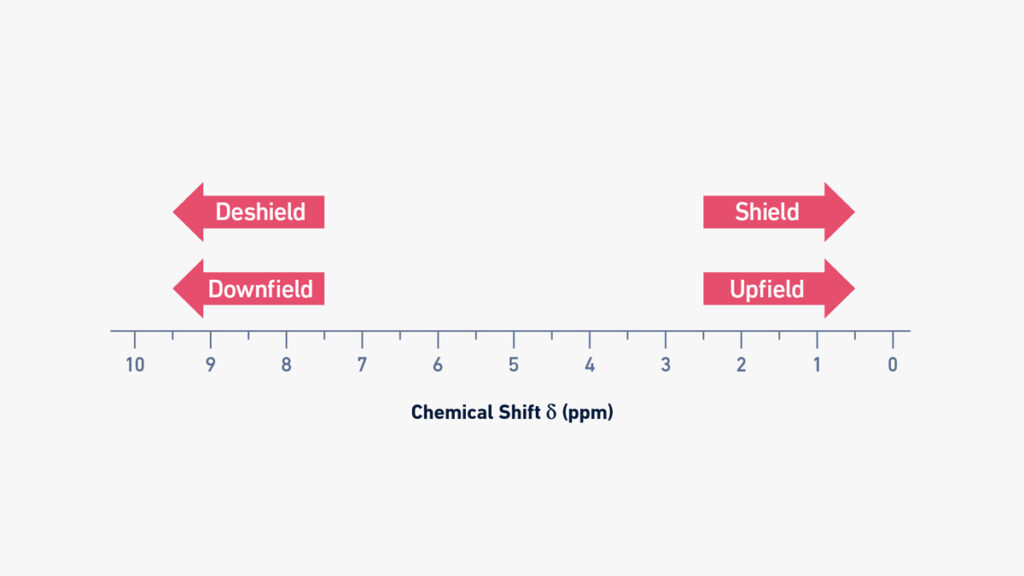
- On a typical NMR spectrum the left side is called downfield and the right side is called upfield.
- Signals appearing downfield (higher ppm value) are from nuclei that are deshielded (less electron density around them) so they feel stronger effective magnetic field.
- Signals appearing upfield (lower ppm value) are from nuclei that are more shielded (higher electron density around them) which reduces the effective magnetic field at the nucleus.
- A nucleus next to an electronegative atom (like oxygen or nitrogen) will often appear downfield because electron density is pulled away, so deshielding happens.
- Conversely, a nucleus in a region surrounded by lots of electrons (alkyl group, no strong withdrawing groups) will show up upfield, that’s the more shielded state.
- The terms “high-field” vs “low-field” are sometimes used: upfield (right‐side) = high field (higher shielding) and downfield (left‐side) = low field (lower shielding) though this is a bit historical.
- It might feel confusing because higher ppm = downfield (left side) while lower ppm = upfield (right side), you’ll want to internalize that.
| Parameter / Feature | Upfield (in NMR) | Downfield (in NMR) |
|---|---|---|
| Position on spectrum – | Located on right-hand side of NMR spectrum. | Found on left-hand side of NMR spectrum. |
| Chemical shift (δ value) – | Has lower ppm value, generally closer to 0 ppm. | Has higher ppm value, generally far from 0 ppm. |
| Shielding condition – | Nuclei are more shielded by surrounding electrons, experience weaker external magnetic field. | Nuclei are deshielded, experience stronger effective magnetic field. |
| Magnetic field strength felt – | Effective field at nucleus is reduced due to electron cloud protection. | Effective magnetic field felt by nucleus is increased (less electron protection). |
| Electron density around nucleus – | High electron density around nucleus, so shielding is greater. | Low electron density, electrons pulled away by electronegative groups. |
| Effect of electronegative atom nearby – | If electronegative atoms absent, signal moves upfield. | Presence of electronegative atom (like O, N, halogen) pulls signal downfield. |
| Energy required for resonance – | Lower frequency / energy absorption required for resonance. | Higher frequency / energy needed for resonance transition. |
| Terminology used sometimes – | Also called “high field” region in old literature. | Also called “low field” region in old references. |
| Examples – | Alkyl protons (–CH₃, –CH₂–) appear in upfield region, around 0.5–2 ppm. | Protons attached to electronegative atoms or aromatic rings appear downfield, around 6–10 ppm etc. |
| Visual direction (graphically) – | Peak shifts to right side of scale. | Peak shifts to left side of scale. |
Proton NMR vs carbon NMR
- The Proton Nuclear Magnetic Resonance (¹H NMR) is used for detecting hydrogen atoms (protons) in a molecule.
- The Carbon‑13 Nuclear Magnetic Resonance (¹³C NMR) is used for detecting the carbon atoms (specifically the ¹³C isotope) in a molecule.
- ¹H NMR gives signals for almost all hydrogen (natural abundance ≈ 99.98 %) so the sensitivity is high, while ¹³C NMR suffers from low natural abundance of ¹³C (≈ 1.1 %) and thus much lower sensitivity.
- In ¹H NMR the signal integration (area under peaks) normally correlates to number of protons giving that signal, so one can tell how many H’s are in that environment.
- In ¹³C NMR the peak heights or areas are not reliably quantitative because of long relaxation times, nuclear Overhauser effect (NOE) differences etc., so you cannot easily tell number of carbons from area.
- ¹H NMR spectra often show multiplicity (splitting patterns) because protons couple to neighbouring protons (spin-spin coupling) and this gives rich structural info.
- ¹³C NMR spectra are often run with proton decoupling so that each distinct carbon appears as a singlet (no splitting by attached H) and coupling to adjacent carbons is rare because ¹³C abundance low, hence simpler spectra.
- The chemical shift range (ppm) is narrower for ¹H NMR (typically ~0-15 ppm for many organic compounds) whereas for ¹³C NMR the range is much wider (0-~220 ppm) which gives better dispersion of peaks for carbons.
- Because ¹³C NMR is less sensitive, longer data acquisition times and larger sample amounts are often required compared to ¹H NMR.
- For complete structure elucidation often both ¹H and ¹³C NMR are used together, because ¹H gives fast, detailed info about hydrogens and ¹³C gives complementary info about skeleton-carbons.
| Feature / Parameter | Proton NMR (¹H NMR) | Carbon NMR (¹³C NMR) |
|---|---|---|
| Detected nucleus – | Detects hydrogen nuclei (protons) in compound. | Detects carbon-13 isotope (¹³C) atoms in compound. |
| Natural abundance – | Very high (~99.98 %), so signals strong and easily observed. | Very low (~1.1 %), signals weak, sensitivity low. |
| Sensitivity – | High sensitivity due to abundant protons & large magnetic moment. | Low sensitivity because fewer ¹³C nuclei and smaller magnetogyric ratio. |
| Signal intensity / integration – | Integration area proportional to number of equivalent protons. | Signal intensity not proportional to carbon number (affected by relaxation & NOE). |
| Chemical shift range – | Narrow range usually 0–15 ppm (for organic compounds). | Wide range roughly 0–220 ppm, gives better separation of peaks. |
| Coupling / splitting – | Shows spin-spin coupling (multiplets) between nearby protons, gives detailed structural info. | Usually recorded with proton decoupling so each carbon appear as singlet (no splitting). |
| Acquisition time – | Faster scan, less signal averaging required. | Longer time required, many scans needed for good S/N ratio. |
| Quantitative use – | Can use quantitatively to find relative number of hydrogens. | Not generally quantitative without special correction methods. |
| Complexity of spectrum – | More complex because of splitting patterns, overlap sometimes. | Simpler spectrum due to decoupling, each carbon separate line. |
| Information provided – | Gives detail about hydrogen environment, bonding, neighboring groups. | Gives information about carbon framework / skeleton of molecule. |
| Typical solvent – | Often CDCl₃, D₂O, CD₃OD, etc., deuterated to avoid H-interference. | Same solvents used but signal from carbons measured. |
| Use in structure elucidation – | Used for quick, high-resolution identification of hydrogen arrangement. | Used to confirm carbon connectivity and distinguish different carbon types (sp³/sp²/sp). |
FAQ
What is NMR spectroscopy?
NMR (Nuclear Magnetic Resonance) spectroscopy is a technique used to study the interaction of atomic nuclei with a strong magnetic field and electromagnetic radiation. It provides information about the chemical structure, dynamics, and interactions of molecules.
How does NMR spectroscopy work?
NMR spectroscopy involves placing a sample in a strong magnetic field and subjecting it to radiofrequency pulses. The atomic nuclei in the sample absorb and re-emit energy at specific frequencies, which can be detected and analyzed to obtain a spectrum.
What information can NMR spectroscopy provide?
NMR spectroscopy can provide information about the molecular structure, chemical environment, connectivity of atoms, molecular dynamics, and interactions between molecules. It can also quantify the amounts of different components in a sample.
What are the common nuclei studied in NMR spectroscopy?
The most commonly studied nuclei in NMR spectroscopy are hydrogen-1 (1H) and carbon-13 (13C). Other nuclei such as nitrogen-15 (15N), oxygen-17 (17O), and phosphorus-31 (31P) can also be studied, depending on the specific application.
What is chemical shift in NMR spectroscopy?
Chemical shift refers to the displacement of NMR signals from a reference compound and is expressed in parts per million (ppm). It provides information about the electronic environment and chemical nature of the atoms in a molecule.
What is coupling in NMR spectroscopy?
Coupling refers to the splitting of NMR signals into multiple peaks due to interactions between neighboring nuclei. It provides information about the connectivity and bonding patterns of atoms in a molecule.
How is NMR spectroscopy used in structural determination?
NMR spectroscopy is widely used to determine the structures of organic molecules, including small organic compounds and complex biomolecules such as proteins and nucleic acids. It can provide information about bond distances, angles, and torsion angles, aiding in the elucidation of molecular structures.
What are the advantages of NMR spectroscopy?
NMR spectroscopy has several advantages, including its non-destructive nature, ability to study samples in various states (solution, solid, tissue), versatility in sample types, high reproducibility, and the range of information it provides about molecules.
What are the limitations of NMR spectroscopy?
Some limitations of NMR spectroscopy include its relatively low sensitivity, especially for certain nuclei, the need for expensive equipment and maintenance, long experimental times for some experiments, spectral interferences from impurities and solvents, and the complexity of spectral analysis for complex samples.
What are common applications of NMR spectroscopy?
NMR spectroscopy finds applications in various fields, including chemistry, biochemistry, pharmaceuticals, materials science, environmental analysis, and forensics. It is used for compound identification, structural determination, monitoring chemical reactions, studying protein-ligand interactions, quality control, and metabolomics, among others.
- Rabi II, Millman S, Kusch P, and Zacharias JR. The molecular beam resonance method for measuring nuclear magnetic moments. the magnetic moments of 3Li6, 3Li7 and 9F19. Phys Rev. 1939. 55(6): 526. doi: 10.1103/PhysRev.55.526
- Bloch F, Hansen W, and Packard M. Nuclear induction. Phys Rev. 69: 127L. doi: 10.1103/PhysRev.70.460
- Purcell EM, Torrey HC, and Pound RV. Resonance absorption by nuclear magnetic moments in a solid. 1946. Phys Rev. 69: 37L. doi: 10.1103/PhysRev.69.37
- Emsley JW, and Feeney J. Milestones in the first fifty years of NMR. 1995. Progr Nucl Mag Res Sp. 28(1): 1-9. doi: 10.1016/0079-6565(95)01023-8
- Marion D. An introduction to biological NMR spectroscopy. Mol Cell Proteomics. 2013. 12(11): 3006-3025. doi: 10.1074/mcp.O113.030239
- Friebolin H & Becconsall JK. (2005). Basic one-and two-dimensional NMR spectroscopy (Vol. 7). Weinheim: Wiley-vch. 2005.
- Hore PJ. Nuclear magnetic resonance. USA: Oxford University Press. 2015.
Derome AE. Modern NMR techniques for chemistry research. Elsevier. 2013. - Wüthrich K. Protein structure determination in solution by NMR spectroscopy. 1990. J Biol Chem. 1990. 265(36): 22059-22062. doi: 10.1016/S0021-9258(18)45665-7
- Jacobsen NE. NMR data interpretation explained: understanding 1D and 2D NMR spectra of organic compounds and natural products. John Wiley & Sons. 2016.
- Bible RH. Interpretation of NMR spectra: an empirical approach. Springer Science & Business Media. 2013.
- Text Highlighting: Select any text in the post content to highlight it
- Text Annotation: Select text and add comments with annotations
- Comment Management: Edit or delete your own comments
- Highlight Management: Remove your own highlights
How to use: Simply select any text in the post content above, and you'll see annotation options. Login here or create an account to get started.