What is Pedigree?
- A pedigree is a specialized diagram used to illustrate the inheritance patterns of genetic traits across generations. Typically employed in the study of humans, animals, and plants, a pedigree chart visually represents the occurrence and distribution of specific phenotypes within a family lineage.
- The term “pedigree” originates from the Anglo-Norman French phrase “pied de grue,” meaning “crane’s foot.” This reference alludes to the chart’s resemblance to a crane’s leg and foot or the use of such marks to denote familial succession in early genealogical records.
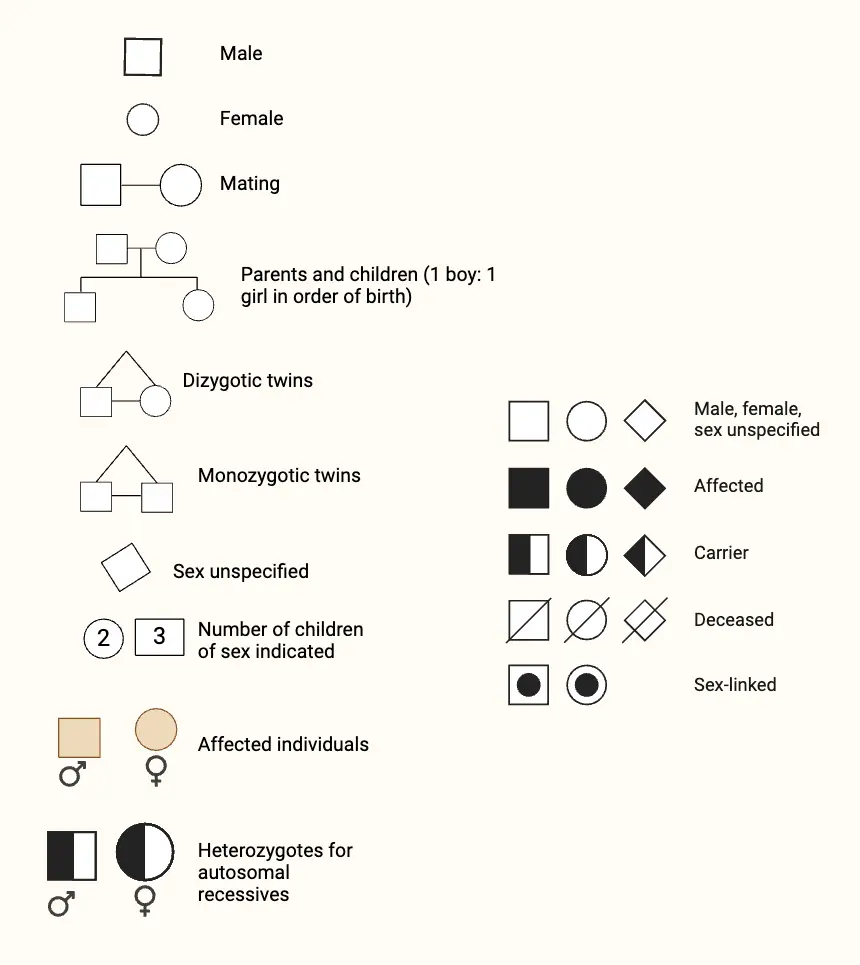
- In essence, a pedigree chart functions as a detailed family tree, presenting information about genetic traits in a clear and organized manner. It utilizes standardized symbols: squares denote males, circles represent females, and diamonds are used for individuals with unknown sex. A filled symbol indicates an individual exhibiting the phenotype of interest, while heterozygotes are often marked with a shaded dot or a half-filled symbol.
- Relationships between individuals are depicted with lines. A horizontal line connects parents, and vertical lines extend to their offspring. Sibling relationships are shown with horizontal lines across the offspring. Twins are connected by a triangle, and deceased individuals are marked with a line through their symbol. Stillborns or aborted fetuses are represented by a small triangle.
- Generations are labeled with Roman numerals (I, II, III, etc.), and individuals within each generation are numbered with Arabic numerals (1, 2, 3, etc.). The analysis of pedigrees, using Mendelian principles, helps determine whether a trait follows a dominant or recessive inheritance pattern. The proband, or the individual with the genetic disorder, is highlighted with an arrow on the pedigree.
What is Pedigree Analysis?
- Pedigree analysis is a method used to understand the inheritance of genetic traits from parents to offspring. This technique involves creating a chart or diagram that visually represents family relationships and the transmission of genetic traits across generations.
- The foundation of pedigree analysis is rooted in Gregor Mendel’s seminal work on inheritance. Mendel’s experiments with pea plants revealed that traits are governed by units of inheritance, now known as genes. Genes, as hereditary units, are responsible for transferring genetic information from parents to their offspring, influencing various characteristics and, in some cases, predisposing individuals to certain genetic disorders.
- Given that direct experimentation on human populations is often impractical due to ethical constraints, pedigree analysis serves as a crucial tool for studying inheritance patterns. By examining family histories, researchers can infer how genetic traits and disorders are passed through generations. This method is particularly useful in identifying Mendelian disorders, which follow specific inheritance patterns described by Mendelian genetics.
- A pedigree chart is a visual representation of a family tree, showing how genetic traits and disorders are distributed among family members. It uses standardized symbols to denote individuals and their relationships, as well as to highlight the presence of genetic disorders within the family lineage. This chart allows for the analysis of inheritance patterns and the assessment of an individual’s risk for genetic conditions based on family history.
Pedigree Analysis Definition
Pedigree analysis is a genetic tool used to trace the inheritance patterns of traits or disorders through generations of a family, helping to predict the likelihood of their occurrence in offspring based on familial history.
Basic Steps of Pedigree Analysis
Pedigree analysis involves several systematic steps to assess and interpret genetic inheritance patterns within a family. The following outlines the fundamental procedures for conducting a pedigree analysis:
- Construct the Pedigree Chart: Begin by organizing a diagram that depicts the family lineage. Each row in the chart corresponds to a generation, while squares and circles represent males and females, respectively. Ensure that individuals within the same row are of the same generation.
- Define Relationships: Indicate marriages or mating relationships using a horizontal line connecting a square and a circle. For consanguineous marriages (between close relatives), use a double horizontal line. Offspring are shown with vertical lines extending downward from the marriage line.
- Symbol Representation:
- Homozygous Individuals: Represent these individuals with fully shaded symbols to denote those who exhibit the trait of interest.
- Heterozygous Individuals: These carriers are shown with half-shaded symbols, indicating they possess one copy of the trait but do not express it fully.
- Indicate Normal and Affected Genotypes:
- Normal Genotype: Unshaded squares and circles signify individuals with a typical genotype or those unaffected by the trait.
- Sex-Linked Traits: For individuals carrying a sex-linked recessive gene, use a dot or black spot within the symbol.
- Highlight Specific Individuals:
- Propositus: The individual under study or who first brought the trait to attention is marked with a pointing arrow. This person is central to the analysis and is often referred to as the propositus.
- Analyze Inheritance Patterns: Use the constructed pedigree to assess how traits are inherited across generations. Apply Mendelian principles to determine if the trait follows a dominant or recessive inheritance pattern, and to identify any potential genetic disorders.
Pedigree Chart Symbols
Type of Pedigree Analysis
Pedigree charts are classified into different types based on the pattern of genetic inheritance. Each type provides distinct insights into how traits are passed through generations. The main types of pedigree analysis are as follows:
- Autosomal Dominant Pedigree:
- Characteristics:
- Affects males and females equally.
- Traits are expressed in every generation or do not skip generations.
- An affected individual may have an unaffected child if the other parent is unaffected.
- Unaffected parents cannot produce affected offspring.
- Heterozygotes display the trait.
- Examples: Huntington’s disease, Marfan syndrome.
- Characteristics:
- Autosomal Recessive Pedigree:
- Characteristics:
- Affects males and females equally.
- Traits may skip generations.
- Two affected parents will only produce affected children.
- Unaffected parents may produce affected offspring if they are carriers (heterozygotes).
- Heterozygotes have a normal phenotype.
- Examples: Cystic fibrosis, Tay-Sachs disease.
- Characteristics:
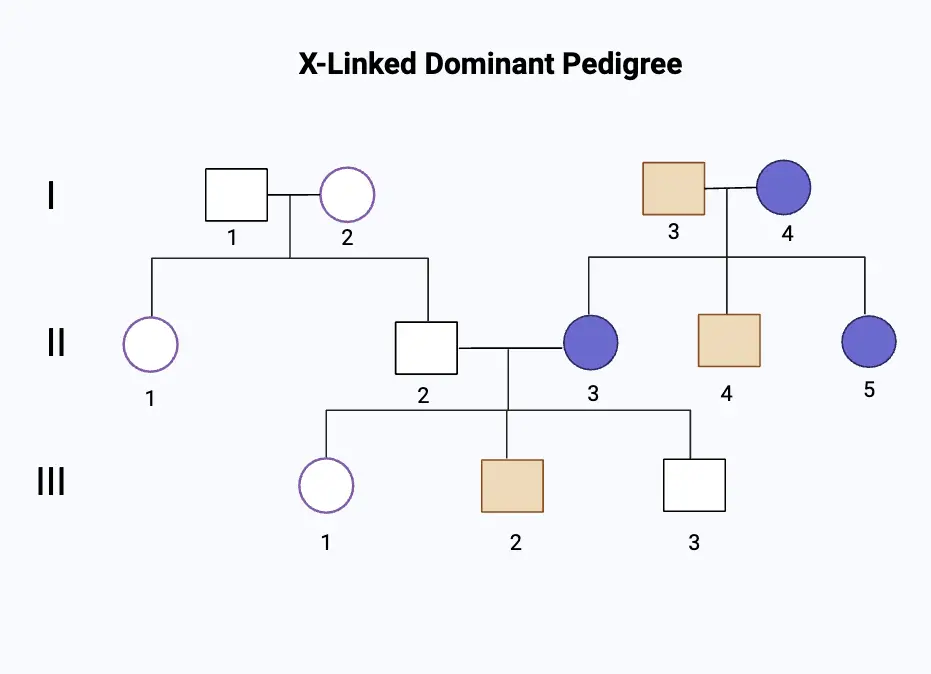
- X-linked Dominant Pedigree:
- Characteristics:
- Affects both males and females, but females may be more frequently affected.
- Traits can skip generations.
- An affected father will pass the trait to all his daughters, but not to his sons.
- Males do not transmit the trait to their sons.
- Examples: Rett syndrome, X-linked vitamin D-resistant rickets.
- Characteristics:
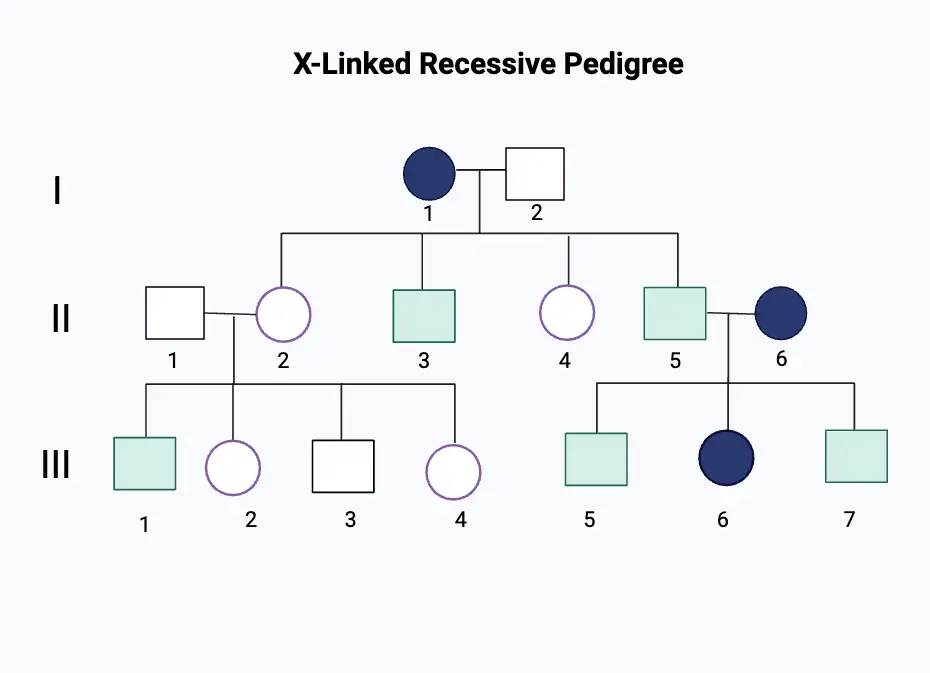
- X-linked Recessive Pedigree:
- Characteristics:
- Males are more frequently affected than females.
- Traits never skip generations.
- Only an affected mother can pass the trait to her sons.
- Males do not transmit the trait to their sons.
- Examples: Hemophilia, color blindness.
- Characteristics:
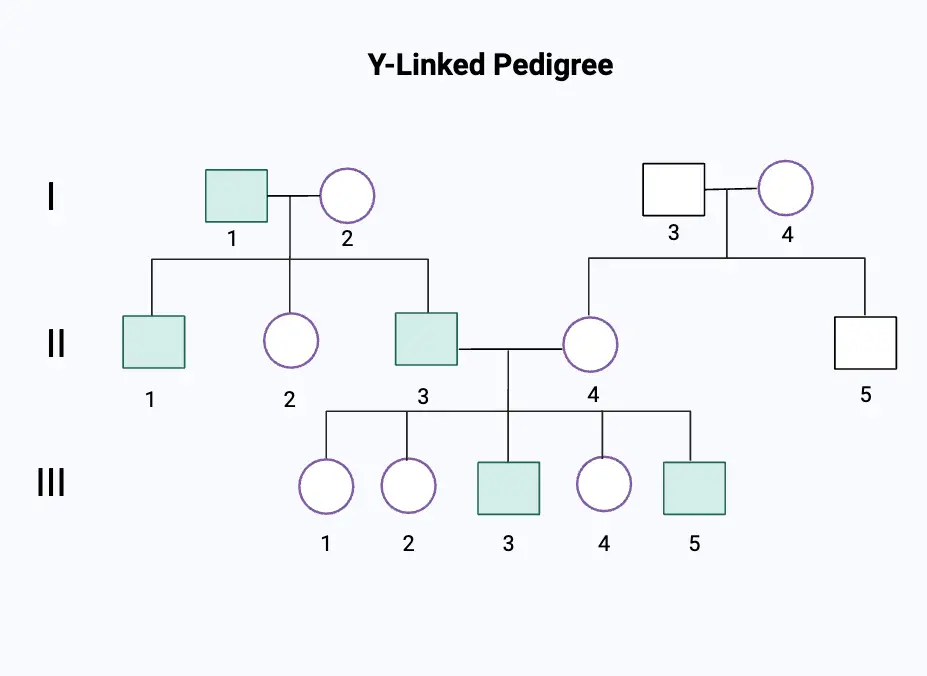
- Y-linked Pedigree:
- Characteristics:
- Affects only males.
- The Y chromosome carries the genetic trait.
- The trait is passed from father to son.
- Examples: Y-linked infertility, some types of hair loss.
- Characteristics:
How to Read a Pedigree Chart?
Reading a pedigree chart involves a systematic approach to interpret the inheritance patterns and genetic traits of individuals across generations. Follow these steps for accurate analysis:
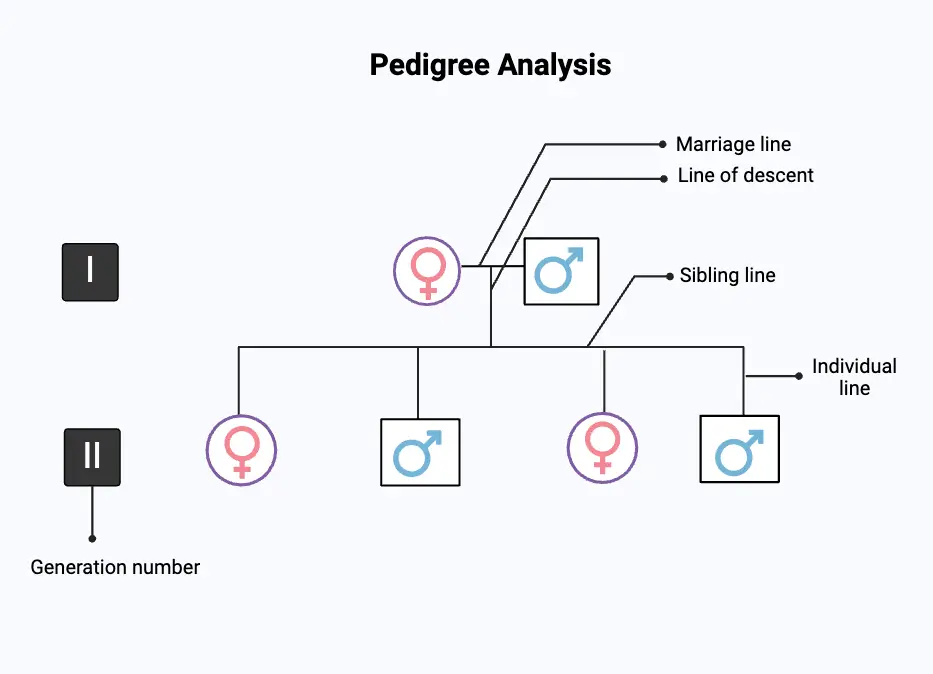
- Understand the Symbols and Structure:
- Individuals: Squares represent males, circles denote females, and diamonds are used for individuals with unknown sex.
- Generations: Number individuals from left to right within each generation. Roman numerals indicate different generations (I, II, III, etc.).
- Marriage Lines: A horizontal line connecting a square and circle signifies a marriage or mating.
- Descent Lines: Vertical lines descend from marriage lines to indicate offspring. Sibling lines connect siblings horizontally.
- Identify the Inheritance Pattern:
- Autosomal Inheritance: Examine whether males and females are equally affected. In autosomal inheritance, the trait is distributed similarly across both sexes.
- Sex-linked Inheritance: Determine if males are more frequently affected. For X-linked traits, the pattern often shows that males are more commonly affected than females.
- Determine the Traits:
- Dominant Traits: Traits that appear in every generation and do not skip generations usually follow a dominant inheritance pattern. An affected individual will have at least one affected parent.
- Recessive Traits: Traits that may skip generations often follow a recessive inheritance pattern. A parent may not exhibit the trait but can be a carrier, passing the trait to offspring.
- Analyze Specific Individuals:
- Affected Individuals: Identify individuals with filled symbols, indicating they express the trait in question.
- Carriers: For recessive traits, look for half-filled symbols or dots indicating carriers. These individuals possess the trait allele but do not express it.
- Propositus: The person who initiated the pedigree study is marked with an arrow, known as the propositus. This individual is central to understanding the trait’s inheritance pattern.
- Review the Patterns:
- Trait Transmission: Observe how the trait is transmitted through generations. In autosomal dominant traits, every affected individual has at least one affected parent. In autosomal recessive traits, two unaffected parents can produce affected offspring if they are carriers.
- Generational Analysis: Assess whether the trait appears in every generation or if it skips generations. This helps distinguish between dominant and recessive inheritance.
Five basic pedigree pattern of inheritance
1. Autosomal Dominant Traits
Autosomal dominant traits are a fundamental concept in genetic inheritance, representing patterns where a single copy of a dominant allele is sufficient to express a particular trait. These traits are characterized by their pattern of transmission and expression within families. Below is a detailed exploration of autosomal dominant traits, their characteristics, and examples.
Key Characteristics of Autosomal Dominant Traits
- Inheritance Pattern:
- Affected Parent: Typically, an individual with an autosomal dominant trait will have at least one affected parent. However, new mutations during gametogenesis can also introduce a dominant trait in an individual with no prior family history.
- Transmission Through Both Sexes: Autosomal dominant traits are transmitted through both males and females equally. The presence of the dominant allele does not depend on the sex chromosomes.
- Expression in Individuals:
- Manifestation in Heterozygotes: An individual only needs one copy of the dominant allele to express the trait. The trait is evident in heterozygous individuals, where the dominant allele masks the effect of the recessive allele.
- Equal Likelihood in Both Genders: Males and females are affected at the same frequency, reflecting the autosomal nature of the trait.
- Generational Transmission:
- Non-Skipping of Generations: Autosomal dominant traits typically do not skip generations. This means if a trait is present in one generation, it is likely to appear in subsequent generations unless incomplete penetrance occurs.
- Penetrance and Expression: In cases of complete penetrance, unaffected individuals do not transmit the trait. Incomplete penetrance, where the trait does not manifest despite the presence of the allele, may lead to apparent skipping of generations.
- Probability of Inheritance:
- Chance of Affected Offspring: When an affected individual (heterozygous) mates with an unaffected individual, there is a 50% chance that their offspring will inherit and express the dominant trait. This probability is consistent with Mendelian inheritance principles.
Examples of Autosomal Dominant Traits
- Neurofibromatosis:
- Description: Characterized by the development of tumor-like growths on nerves throughout the body. It manifests as skin lesions, café-au-lait spots, and, in severe cases, neurological complications.
- Familial Hypercholesterolemia:
- Description: An inherited condition leading to high cholesterol levels in the blood. It increases the risk of cardiovascular disease due to impaired cholesterol metabolism.
- Phenylthiocarbamide (PTC) Tasting:
- Description: The ability to taste PTC, a bitter compound, varies among individuals. Those with the dominant allele can taste PTC, while those with the recessive allele cannot.
- Marfan Syndrome:
- Description: A connective tissue disorder that affects the heart, eyes, and skeletal system. Individuals with Marfan syndrome often have elongated limbs, a tall stature, and heart valve abnormalities.
- Brachydactyly:
- Description: A condition characterized by shortened fingers and toes. It results from the presence of a dominant allele affecting the development of digits.
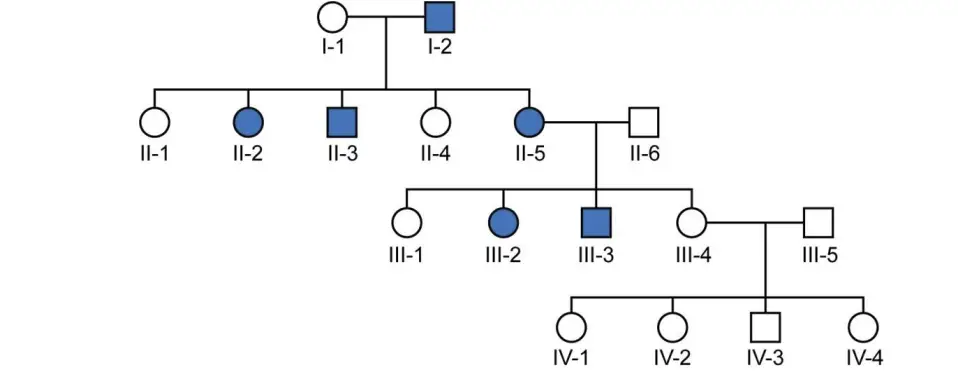
2. Autosomal Recessive Traits
Autosomal recessive traits are inherited according to a specific pattern where the trait is only expressed when an individual carries two copies of a recessive allele. These traits exhibit unique patterns of inheritance and are characterized by several distinct features.
Key Characteristics of Autosomal Recessive Traits
- Expression and Inheritance:
- Recessive Allele Requirement: An autosomal recessive trait manifests only when an individual possesses two copies of the recessive allele. This means that both alleles at the relevant genetic locus must be recessive for the trait to be observed.
- Equal Frequency Across Sexes: Like autosomal dominant traits, autosomal recessive traits occur with equal frequency in both males and females. The trait is inherited independently of the sex chromosomes.
- Generational Patterns:
- Generation Skipping: Autosomal recessive traits often skip generations. This occurs because the trait can remain hidden in carriers who possess only one recessive allele and do not exhibit the trait themselves.
- Affected Offspring from Unaffected Parents: Individuals with autosomal recessive traits are generally born to unaffected parents who are heterozygous carriers. Carriers typically do not show symptoms of the recessive trait but can pass the allele to their offspring.
- Incidence and Risk Factors:
- Increased Incidence in Consanguinity: The frequency of autosomal recessive traits increases in consanguineous marriages, where close relatives mate. This is due to a higher likelihood of both parents carrying the same recessive allele due to shared ancestry.
- Probability in Carrier Mating: When two heterozygous carriers (each possessing one recessive allele) mate, there is a 25% chance that their offspring will inherit two recessive alleles and therefore express the trait. However, this probability may not be evident in small families due to limited sample sizes.
Examples of Autosomal Recessive Traits
- Phenylketonuria (PKU):
- Description: PKU is a metabolic disorder caused by a deficiency in the enzyme phenylalanine hydroxylase. This leads to an accumulation of phenylalanine in the blood, which can cause intellectual disabilities and other neurological issues if not managed through a specialized diet.
- Cystic Fibrosis:
- Description: Cystic fibrosis is a genetic disorder that affects the respiratory and digestive systems. It is caused by mutations in the CFTR gene, leading to the production of thick, sticky mucus that obstructs the airways and other organs.
- Alkaptonuria:
- Description: This condition results from a deficiency in the enzyme homogentisate oxidase, causing the accumulation of homogentisic acid. It leads to a condition known as ochronosis, characterized by darkening of the urine and damage to cartilage and connective tissues.
- Glycogen Storage Diseases:
- Description: These are a group of disorders characterized by deficiencies in enzymes involved in glycogen metabolism. Examples include Pompe disease and McArdle disease, which affect the body’s ability to store and use glycogen properly.
- Tay-Sachs Disease:
- Description: Tay-Sachs is a fatal genetic disorder caused by a deficiency of the enzyme hexosaminidase A. It leads to the accumulation of GM2 gangliosides in the nerve cells, resulting in progressive neurodegeneration and early death.
- Sickle Cell Anemia:
- Description: Sickle cell anemia is caused by a mutation in the hemoglobin gene that leads to the production of abnormal hemoglobin. This results in red blood cells that are sickle-shaped, causing pain, anemia, and organ damage due to impaired blood flow.
3. X-Linked Dominant Traits
X-linked dominant traits are inherited according to a specific pattern linked to the X chromosome. These traits are characterized by their mode of inheritance and their expression in both males and females.
Key Characteristics of X-Linked Dominant Traits
- Inheritance Pattern:
- Both Sexes Affected: X-linked dominant traits can manifest in both males and females. However, these traits are more frequently observed in females due to their two X chromosomes, compared to males who have only one X chromosome.
- Non-Skipping Generations: Unlike autosomal dominant traits, X-linked dominant traits do not skip generations. This means that if a trait is present in a family, it is generally seen in every generation.
- Transmission:
- Male Inheritance: A male who carries an X-linked dominant trait inherits it from his mother. Since males have only one X chromosome, they pass this trait to all their daughters but none of their sons.
- Female Inheritance: A female with an X-linked dominant trait receives one X chromosome with the trait from either parent. Consequently, either parent can transmit the trait to their offspring.
- Offspring Probability:
- Inheritance from Affected Mother: The children of an affected mother have a 50% chance of inheriting the trait, regardless of their sex. This is due to the random inheritance of the X chromosomes.
- Affected Parent Requirement: Each child of an affected individual will inherit the trait from at least one parent who is affected.
- Sex-Based Variation:
- Severity Differences: Females with X-linked dominant traits often exhibit milder symptoms compared to males. This difference is attributed to random X-inactivation in females, where one of the two X chromosomes in each cell is randomly deactivated.
- Sex-Specific Expression: Some X-linked dominant disorders affect only females. This is usually due to lethal effects on males during fetal development, leading to a situation where only females are born with the trait.
Examples of X-Linked Dominant Traits
- Hypophosphatemia (Familial Vitamin D-Resistant Rickets):
- Description: Hypophosphatemia is caused by defective phosphate transport, particularly in kidney cells, leading to excessive phosphate loss in urine. This disorder results in bone deformities, curved legs, and growth deficiencies. Males with this condition are often more severely affected compared to females.
- Rett Syndrome:
- Description: Rett syndrome is a neurological disorder that primarily affects females and leads to severe cognitive and motor impairments. It is associated with mutations in the MECP2 gene on the X chromosome.
- Renal Phosphate Transport Disorder:
- Description: This condition involves defective renal phosphate reabsorption, leading to phosphate wasting and bone issues similar to hypophosphatemia. It can also result in similar skeletal abnormalities and is often more severe in males.
- Incontinentia Pigmenti Type I:
- Description: Incontinentia pigmenti is an X-linked dominant disorder that affects only females. It causes skin abnormalities and other systemic manifestations. Males with this condition do not survive to birth due to the severe effects of the disorder.
4. X-Linked Recessive Traits
X-linked recessive traits are inherited according to a distinct pattern linked to the X chromosome. These traits are primarily characterized by their prevalence in males and specific patterns of inheritance.
Key Characteristics of X-Linked Recessive Traits
- Inheritance Pattern:
- Prevalence in Males: X-linked recessive traits predominantly affect males. This is because males have only one X chromosome, so a single recessive allele on this chromosome will manifest the trait. In contrast, females have two X chromosomes, so they require two copies of the recessive allele to exhibit the trait.
- Generation Skipping: These traits often appear to skip generations. This occurs when the trait is passed from an unaffected mother, who is a carrier, to her son. The son then passes the trait to his daughters, who become carriers. The trait may reappear in subsequent generations.
- Transmission Dynamics:
- Carrier Mothers: A mother who is an asymptomatic carrier of an X-linked recessive trait may have affected male relatives. This is due to the inheritance of the X chromosome carrying the recessive allele.
- Offspring Probability:
- Approximately 50% of the sons of a carrier mother will be affected by the trait.
- Around 50% of the daughters of a carrier mother will also be carriers, though this ratio may vary slightly depending on family size.
- Sex-Specific Inheritance:
- No Father-to-Son Transmission: An X-linked recessive trait cannot be passed from father to son. This is because a father transmits his Y chromosome to his sons, not his X chromosome.
- Carrier Daughters: All daughters of an affected male will be carriers if the mother is homozygous dominant (i.e., does not carry the recessive allele).
Examples of X-Linked Recessive Traits
- Classic Hemophilia:
- Description: Hemophilia is a blood clotting disorder caused by mutations in genes on the X chromosome. Affected individuals have difficulty with blood clotting, leading to prolonged bleeding. This disorder predominantly affects males and is inherited from carrier mothers.
- Red-Green Color Blindness:
- Description: This condition involves the inability to distinguish between red and green colors, due to defects in the X-linked genes responsible for color vision. It is more common in males and is passed from carrier mothers.
- Lesch-Nyhan Syndrome:
- Description: Lesch-Nyhan syndrome is a metabolic disorder caused by mutations in the HPRT1 gene on the X chromosome. It results in neurological and behavioral abnormalities, including self-mutilation and gout. The condition is almost exclusively observed in males.
- Duchenne Muscular Dystrophy (DMD):
- Description: DMD is a severe form of muscular dystrophy characterized by progressive muscle degeneration and weakness. It is caused by mutations in the dystrophin gene on the X chromosome and primarily affects males.
- Menkes Disease:
- Description: Menkes disease is a copper metabolism disorder caused by mutations in the ATP7A gene. It leads to neurological and developmental problems and is inherited in an X-linked recessive manner.
5. Y-Linked Traits
Y-linked traits, also known as holandric traits, are inherited exclusively through the Y chromosome. They follow a distinct pattern of inheritance that is specific to the male sex due to the nature of the Y chromosome. Here is a detailed examination of the characteristics and implications of Y-linked traits:
Characteristics of Y-Linked Traits
- Inheritance Pattern:
- Father-to-Son Transmission: Y-linked traits are passed directly from father to all sons. This is because the Y chromosome is inherited only through paternal lines, and any gene located on this chromosome will be transmitted to male offspring.
- Exclusively Affects Males: Since only males possess a Y chromosome, traits linked to it are expressed only in males. Females, who do not have a Y chromosome, cannot exhibit Y-linked traits.
- Generation Continuity:
- No Skipping of Generations: Y-linked traits are characterized by a continuous inheritance pattern. They do not skip generations as they are consistently passed from father to son. Each affected male will have affected sons, as the trait is directly linked to the Y chromosome.
- Associated Health Implications:
- Effects on Male Fertility: Mutations in Y-linked genes can impact male fertility. Certain Y-linked disorders can result in reduced fertility or other reproductive issues due to disruptions in normal Y chromosome function.
Examples of Y-Linked Traits
- Holandric Traits:
- Description: Holandric traits are those directly linked to the Y chromosome’s non-recombining region. These traits are inherited in a straightforward manner from father to son, without involvement of female carriers.
- Sry Gene and Male Sex Determination:
- Description: The Sry gene (Sex-determining Region Y) is crucial for the development of male characteristics. It triggers the formation of testes and the production of male hormones. Mutations in the Sry gene can lead to disorders of sexual development.
Terms To study Pedigree
Here are key terms and concepts essential for analyzing pedigrees:
- Symbols:
- Square: Represents a male individual in the pedigree chart.
- Circle: Represents a female individual.
- Diamond: Used to denote an individual whose sex is unknown.
- Generations:
- Roman Numerals: Generations are labeled using Roman numerals, starting with I (the oldest generation) and moving sequentially downward through the generations (e.g., II, III).
- Relationships:
- Horizontal Line: Indicates a marriage or mating between individuals. This line connects a square and a circle, representing the union of a male and female.
- Vertical Line: Extends downward from a horizontal line, showing offspring produced by the marriage.
- Affected Individuals:
- Shaded Symbol: Indicates individuals who exhibit the genetic trait or condition under study. Shading can be partial or complete depending on whether the trait is dominant or recessive.
- Unaffected Individuals:
- Unshaded Symbol: Represents individuals who do not exhibit the genetic trait. These individuals are often referred to as “normal” or “wild type.”
- Genotype Notation:
- Half-Shaded Symbol: Represents carriers of a recessive trait. These individuals do not show the trait but can pass it to their offspring.
- Black Spot: Often used in the middle of a symbol to indicate a carrier of a sex-linked recessive trait.
- Propositus:
- Arrow or Mark: Affected individual who is the subject of study. The propositus is typically marked with an arrow to indicate the focus of the genetic analysis.
- Deceased Individuals:
- Small Blackened Symbols: Used to represent individuals who have died, particularly in infancy or early childhood. These symbols provide context for understanding the family’s genetic history.
- Consanguinity:
- Double Horizontal Line: Represents a consanguineous marriage, where the partners are related by blood. This can influence the likelihood of genetic disorders being passed to offspring.
Limitations of Pedigree Analysis
- Small Family Size:
- Issue: In many cases, family sizes are small, which reduces the likelihood of observing a sufficient number of affected individuals to clearly determine the mode of inheritance.
- Impact: The limited number of progenies in small families makes it challenging to predict inheritance patterns with high confidence based on a single pedigree.
- Incomplete Family Records:
- Issue: Family medical histories and records are often incomplete or inaccurate.
- Impact: Gaps in family history can obscure the inheritance pattern and make it difficult to establish clear genetic links or confirm the presence of specific genetic traits.
- Controlled Matings Unavailable:
- Issue: Unlike model organisms where controlled matings can be arranged, human mating is influenced by social, cultural, and personal factors that are unrelated to genetic research.
- Impact: This lack of control complicates the study of inheritance patterns, as geneticists cannot easily manipulate mating conditions to observe specific genetic outcomes.
- Long Generation Time:
- Issue: Humans have a relatively long generation time, reaching reproductive maturity around 12-14 years and often reproducing at older ages.
- Impact: The extended time frame between generations can slow down the process of genetic analysis and complicate the study of hereditary conditions over multiple generations.
- Incomplete Penetrance:
- Issue: Some dominant genetic conditions exhibit incomplete penetrance, meaning that the trait may not be expressed in every individual carrying the dominant allele.
- Impact: This can lead to traits skipping generations, making it difficult to accurately assess inheritance patterns. Incomplete penetrance is particularly problematic in late-onset diseases where symptoms may not appear until later in life.
- Imprinted Genes:
- Issue: Certain genetic conditions may only manifest when inherited from one parent due to imprinting effects.
- Impact: This selective expression based on parental origin can complicate the interpretation of pedigrees, as the trait’s appearance may be contingent on which parent passed on the gene.
- Male Lethality of X-Linked Dominant Conditions:
- Issue: Some X-linked dominant conditions are lethal in males, preventing them from being passed on to subsequent generations.
- Impact: Affected females may pass the trait to their daughters but not to their sons, complicating the analysis of X-linked dominant traits in pedigrees.
- Genetic Heterogeneity:
- Issue: Some genetic disorders are caused by mutations in multiple genes, each potentially following a different inheritance pattern (locus heterogeneity).
- Impact: This can make pedigree analysis ambiguous, particularly for complex diseases involving multiple genetic factors and interactions.
Significance of Pedigree Analysis
- Predicting Inheritance Patterns:
- Explanation: Pedigree analysis enables the prediction of how a genetic trait is passed through generations. By examining family trees, one can identify whether a trait follows autosomal dominant, autosomal recessive, X-linked dominant, X-linked recessive, or Y-linked patterns.
- Impact: This prediction helps in understanding the likelihood of the trait appearing in offspring and aids in the genetic counseling process.
- Genetic Counseling:
- Explanation: Genetic counselors use pedigree analysis to educate prospective parents about the risks of inheriting genetic traits. This information is critical for families planning to have children, particularly if there is a known history of genetic disorders.
- Impact: Counselors provide guidance on the probability of passing on genetic conditions and discuss options for prenatal and postnatal testing.
- Prenatal Testing:
- Explanation: Pedigree analysis informs the decision to undertake various prenatal tests such as ultrasonography, amniocentesis, chorionic villus sampling, and maternal blood testing.
- Impact: Early detection of genetic abnormalities allows for intervention strategies that may prevent or mitigate the impact of these conditions. It helps families prepare for potential outcomes or make informed decisions about pregnancy continuation.
- Postnatal Testing:
- Explanation: After birth, genetic testing can confirm the presence of genetic disorders in newborns. Pedigree analysis also facilitates heterozygote screening for conditions that may not yet present symptoms but could affect future generations.
- Impact: Postnatal testing aids in early diagnosis and management of genetic conditions, and helps in tailoring personalized medical treatments based on genetic information.
- Management of Genetic Conditions:
- Explanation: For children born with genetic abnormalities where no specific treatments are available, pedigree analysis can guide management strategies and help families understand the prognosis.
- Impact: It assists in planning for future care needs and facilitates support for families dealing with untreatable conditions.
- Counseling for Relatives and Older Parents:
- Explanation: Pedigree analysis is valuable for advising couples who are closely related or older parents planning to conceive. It provides insights into the potential genetic risks based on family history.
- Impact: This information helps in making informed decisions about family planning and risk management.
Examples of Pedigree Analysis
Pedigree charts are instrumental in understanding the inheritance patterns of genetic traits. Here are detailed examples illustrating various types of inheritance patterns using pedigree charts:
- Autosomal Dominant Pedigree:
- Description: In an autosomal dominant pedigree, a dominant trait is evident when at least one parent exhibits the trait, and it appears in every generation. For instance, if one parent in the F1 generation is affected, the trait is passed to the offspring in the F2 generation.
- Example Analysis: Observe a pedigree where an affected parent produces affected and unaffected offspring in the F2 generation. Unaffected parents in the F3 generation also produce unaffected children. The equal ratio of affected males and females across generations indicates autosomal dominant inheritance. A key feature is that affected individuals must have at least one affected parent.
- Autosomal Recessive Pedigree:
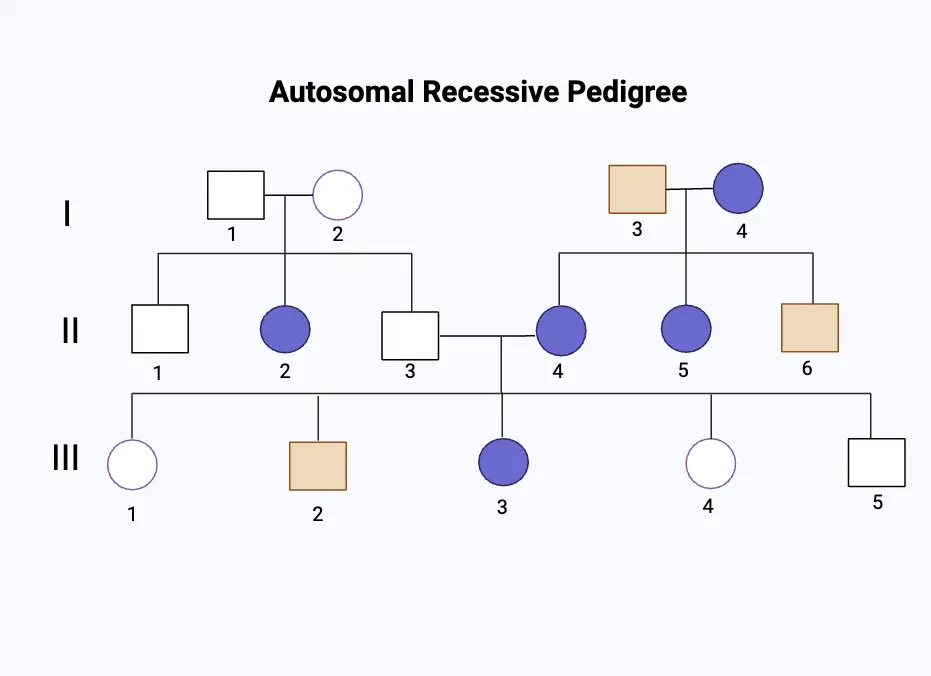
- Description: Autosomal recessive traits may skip generations and require both parents to be carriers for the trait to manifest in the offspring. Affected individuals typically arise when both parents are carriers.
- Example Analysis: In a pedigree, if unaffected parents in the F1 generation produce an affected child in the F2 generation, this suggests a recessive trait. Affected parents in another family produce only affected children. The equal ratio of affected males and females in the F3 generation further supports autosomal recessive inheritance. The presence of affected individuals despite both parents being unaffected indicates that they are carriers.
- X-Linked Dominant Pedigree:
- Description: X-linked dominant traits appear in both males and females, but the trait is transmitted from an affected father to all of his daughters. Male-to-male transmission does not occur.
- Example Analysis: A pedigree shows an unaffected couple in the F1 generation with unaffected children, while an affected couple produces affected daughters and an unaffected son. This pattern indicates X-linked dominant inheritance. Affected fathers passing the trait to all daughters but not to sons confirms that the trait is X-linked dominant. The crisscross pattern of inheritance across generations supports this conclusion.
- X-Linked Recessive Pedigree:
- Description: X-linked recessive traits typically affect more males than females. An affected mother will pass the trait to all her sons, and the trait may skip generations if females are carriers.
- Example Analysis: In the pedigree, an affected mother transmits the trait to her sons in the F2 generation, illustrating X-linked recessive inheritance. If unaffected parents produce affected children in the F3 generation, it suggests that both parents are carriers. The predominance of affected males and the inheritance pattern confirm X-linked recessive traits.
- Y-Linked Pedigree:
- Description: Y-linked traits are passed exclusively from father to son, affecting only males in a family.
- Example Analysis: A pedigree shows that an affected male in the F1 generation transmits the trait to all his sons in the F2 generation. If an unaffected father in the F1 generation has no affected sons, the trait does not pass to the next generation. The presence of affected males only and the transmission pattern from father to son confirm Y-linked inheritance.
Fun Facts About Pedigree Analysis
- Did you know that pedigree analysis can help identify patterns of inheritance for various genetic traits, from eye color to rare genetic disorders, by examining family trees?
- Have you heard that a pedigree chart often uses symbols such as circles for females and squares for males, with shaded symbols indicating affected individuals?
- Are you aware that pedigree analysis can reveal whether a trait is autosomal or sex-linked by tracing its inheritance through multiple generations?
- Did you know that by studying pedigrees, geneticists can often predict the likelihood of a trait appearing in future generations based on known inheritance patterns?
- Can you believe that pedigree analysis can help identify carriers of genetic disorders, even if they do not show symptoms of the disease themselves?
- Have you ever heard that some genetic conditions, such as hemophilia, are more likely to appear in males due to their X-linked recessive inheritance pattern?
- Did you know that pedigree analysis can be used to trace inherited traits in both humans and animals, making it a versatile tool in genetics research?
- Are you aware that certain genetic disorders, like cystic fibrosis, may appear to skip generations in a pedigree due to carriers passing on recessive alleles?
- Did you know that pedigree charts can help genetic counselors provide important information to families about the risk of passing on genetic conditions?
- Can you believe that the study of pedigrees has helped scientists discover the genetic basis of many inherited diseases, advancing our understanding of human genetics?
- Have you heard that in some cases, pedigree analysis can reveal complex inheritance patterns, such as those involving multiple genes or incomplete penetrance?
- Did you know that geneticists often use pedigrees to differentiate between dominant and recessive traits by examining whether affected individuals have affected parents?
- Are you aware that pedigree analysis can sometimes uncover unexpected results, such as non-paternity events or adoption, by revealing discrepancies in inheritance patterns?
- Did you know that pedigree charts can help in understanding X-linked dominant traits, where both males and females can be affected but the trait does not skip generations?
- Can you believe that pedigree analysis can be used to study rare genetic disorders by tracking their occurrence within extended families or across populations?
- Have you heard that pedigree analysis has been crucial in understanding hereditary cancers, such as breast cancer, by identifying genetic mutations that increase risk?
- Did you know that some genetic traits, like certain types of color blindness, can be traced through pedigree analysis to understand their inheritance patterns and prevalence?
- Are you aware that pedigree charts can also be used in animal breeding programs to track desirable traits and avoid inbreeding in livestock and pets?
- Did you know that pedigree analysis can sometimes reveal the need for genetic testing or counseling for individuals who may be at risk of inherited conditions?
- Can you believe that advances in genomic technologies are now complementing traditional pedigree analysis, providing even more detailed insights into genetic inheritance patterns?
- https://biologyreader.com/pedigree-analysis-chart.html
- https://egyankosh.ac.in/bitstream/123456789/88472/3/Unit-9.pdf
- https://theory.labster.com/pedigree-analysis/
- https://www.brainkart.com/article/Pedigree-Analysis_38046/
- https://www.cs.cmu.edu/~genetics/units/instructions/instructions-PBA.pdf
- https://en.wikipedia.org/wiki/Pedigree_chart
- https://www.ndsu.edu/pubweb/~mcclean/plsc431/mendel/mendel9.htm
- Text Highlighting: Select any text in the post content to highlight it
- Text Annotation: Select text and add comments with annotations
- Comment Management: Edit or delete your own comments
- Highlight Management: Remove your own highlights
How to use: Simply select any text in the post content above, and you'll see annotation options. Login here or create an account to get started.