A phylogenetic tree (also phylogeny or evolutionary tree) is a branching diagram or a tree that illustrates the evolutionary relationships between various biological species or other entities based on similarities and differences in their physical or genetic characteristics. All life on Earth belongs to a singular phylogenetic tree, indicating a shared ancestry.
In a rooted phylogenetic tree, each node with descendants represents the inferred most recent common ancestor of those descendants[4], and in some trees, the edge lengths can be interpreted as time estimates. Every node is referred to as a taxonomic unit. Internal nodes are typically referred to as hypothetical taxonomic units because they cannot be observed directly. Biomedical disciplines such as bioinformatics, systematics, and phylogenetics find trees valuable. Unrooted trees illustrate only the relatedness of the leaf nodes and do not necessitate the knowledge or inference of the ancestral root.
Ancient conceptions of a ladder-like progression from lower to higher forms of life (such as in the Great Chain of Being) gave rise to the concept of a tree of life. Early depictions of “branching” phylogenetic trees include a “paleontological chart” depicting the geological relationships between plants and animals in Edward Hitchcock’s (1800s) book Elementary Geology.
In his 1859 book On the Origin of Species, Charles Darwin depicted an evolutionary “tree” as a diagram. Over a century later, evolutionary biologists continue to use tree diagrams to illustrate evolution because they effectively convey the concept that speciation occurs through the adaptive and semirandom division of lineages.
The term phylogenetic or phylogeny is derived from the ancient Greek words v (phûlon), which means “race” or “lineage,” and (génesis), which means “origin” or “source.”
What is a phylogenetic tree?
- Phylogenetic tree is a branching diagram that shows the inferred evolutionary relationships among various species or organisms based on genetic, morphological, or molecular data.
- It’s made up of branches, nodes, root, leaves–
- Branches – they represent evolutionary paths, sometimes proportional to time or genetic change
- Nodes – indicate a common ancestor, mostly where lineages diverge
- Root – the ancestral lineage from which all others diverged
- Leaves – the terminal ends that represent current species or taxa
- It’s used to depict hypothesized evolutionary history, it helps in understanding species diversification, genetic similarities, shared ancestry, etc
- Phylogenetic tree categorized based on construction and interpretation–
- Cladograms – just show relationship, not time
- Phylograms – branch length shows amount of change
- Ultrametric trees – branch length indicates time
- It’s constructed using DNA, RNA, protein sequences, or morphological traits, but mostly molecular data preferred due to accuracy
- It’s often misread as showing direct ancestry, but in reality, it shows common ancestry not necessarily who came from whom
- It’s useful in taxonomy, evolutionary biology, epidemiology, and also comparative genomics, where relationships among genes or species are explored
- Errors may occur due to horizontal gene transfer, convergent evolution, or insufficient data which leads to misleading branching patterns
- It’s made using tools like MEGA, PhyML, BEAST, MrBayes, etc, and needs alignment, model selection, tree building, and validation
Phylogenetic tree definition
Phylogenetic tree – it’s a diagram that shows evolutionary relationships among species or genes based on common ancestry using genetic or morphological data.
Parts of a Phylogenetic Tree
The primary components of a phylogenetic tree are as follows:
- Branches – they represent evolutionary lineages, sometimes proportional to genetic change or time
- Root – it’s the base node, shows the most recent common ancestor of all included taxa
- Nodes – points where lineages diverge, indicate a hypothetical common ancestor
- Internal nodes – represent ancestral species from which others evolved
- Terminal nodes (leaves/tips) – show current species, genes, or taxa being studied
- Clade – a group that includes an ancestor and all its descendants, often shown as a subtree
- Outgroup – it’s a taxon that diverged earlier, used as a reference point to root the tree
- Sister taxa – two lineages that share a common node, meaning they’re closely related
- Polytomy – a node with more than two descendant branches, often due to unresolved relationships
- Branch length – sometimes indicates the amount of change or evolutionary time, depends on tree type
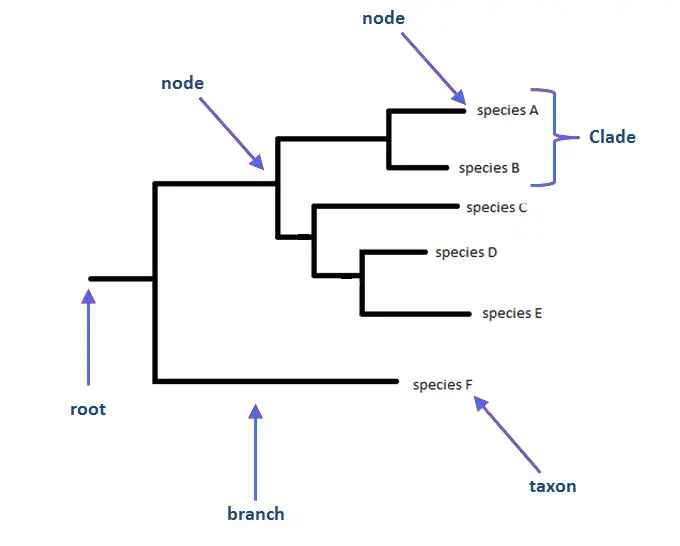
Types of Phylogenetic Tree
A. Types of Phylogenetic Tree On presence or absence of a common root
On the basis of presence or absence of a common root Phylogenetic Tree is classified into two categories; such as Rooted Phylogenetic Tree and Unrooted Phylogenetic Tree.
1. Rooted Phylogenetic Tree – it has a single common ancestor (root) for all taxa, shows direction of evolution from ancestor to descendants
- it helps in understanding evolutionary time, lineage splitting, ancestral traits

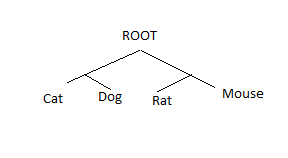
2. Unrooted Phylogenetic Tree – no defined root, it only shows relationships among species but not evolutionary path
- it’s used when the root position is uncertain or not needed, still useful for analyzing genetic closeness


Types of Phylogenetic On the basis of topology
On the basis of their topology, phylogenetic trees can be divided into the following categories:
1. Cladogram
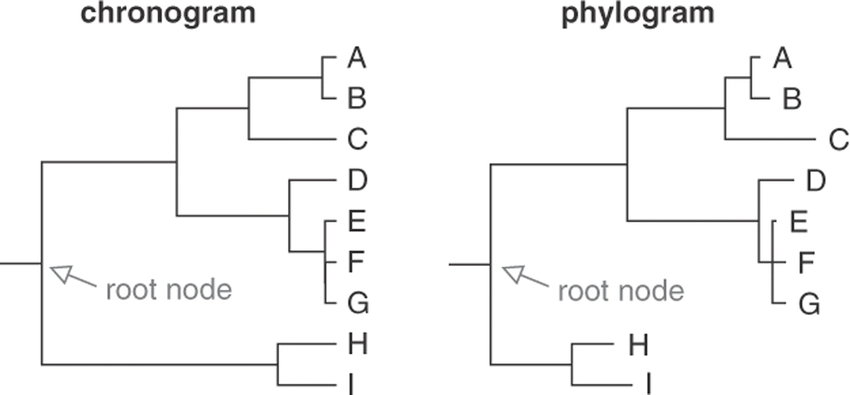
A cladogram is a form of phylogenetic tree that illustrates the branching pattern of evolutionary relationships between taxa. It indicates the order of divergence but not the quantity of time or evolutionary change that has taken place. Cladograms consist of branches that divide at nodes, representing common ancestors, and their lengths are typically equal.
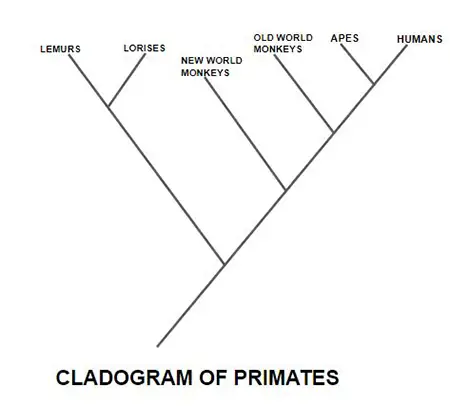
2. Phylogram
A phylogram is a form of phylogenetic tree that uses branch lengths to represent the degree of evolutionary change. Indicating the relative amount of time or evolutionary distance between nodes, branch lengths can be proportional to genetic or morphological differences. Phylograms add to our understanding of the magnitude of evolutionary change.
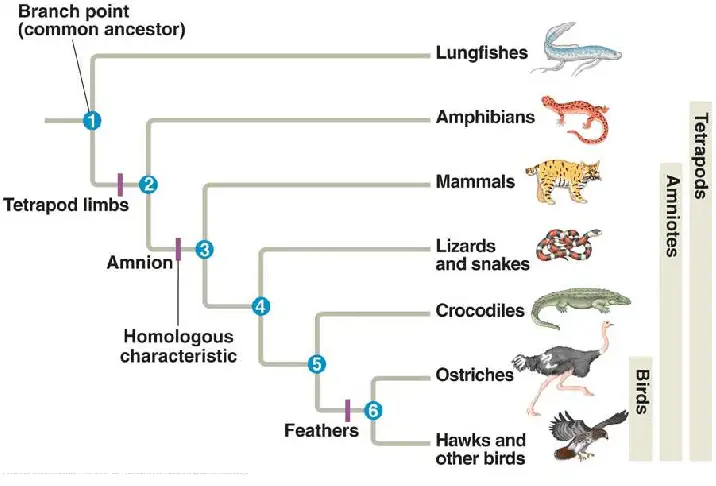
3. Chronogram
A chronogram, also known as a time tree, is a scaled phylogenetic tree that depicts the estimated time of divergence between species or groups. In a chronogram, the branch lengths are proportional to the estimated time since divergence, which is typically derived from fossil records or molecular clock analyses. Chronograms provide a temporal perspective, enabling the visualization of evolutionary event timing.
4. Network Tree
A network tree, also known as a reticulated tree, is a form of phylogenetic representation consisting of reticulations or interconnected branches. When complex evolutionary processes, such as hybridization, horizontal gene transfer, or recombination, cannot be adequately represented by a simple bifurcating tree structure, this method is employed. The exchange of genetic material between distinct lineages can be visualized via network structures.

5. Fan Tree
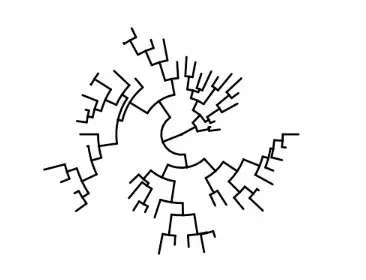
A fan tree is a form of phylogenetic tree that illustrates the relationships between taxa by utilizing multiple branches emanating from a single node. It is frequently used to represent rapid radiations or evolutionary events in which multiple lineages emerge from a common ancestor within a brief period of time. Fan trees illustrate the divergence of lineages without specifying their sequence.
6. Polytomy
A polytomy is a characteristic of a phylogenetic tree in which three or more branches arise from a single node. It signifies an unresolved relationship in which the precise order or sequence of divergence is unknown. Polytomies can occur when there is insufficient data or when simultaneous rapid divergence events occur.
Differences Between Chronogram and Phylogram tree
| Criteria | Chronogram Tree | Phylogram Tree |
|---|---|---|
| Time Information | Includes time scale, indicating the estimated time of divergence between lineages. | Does not include explicit time scale information. |
| Branch Lengths | Branch lengths represent evolutionary time (usually in units such as years or generations). Longer branches indicate longer periods of evolutionary divergence. | Branch lengths typically represent some measure of genetic or evolutionary distance. They do not directly represent time. |
| Time Calibration | Requires calibration points (fossil records, geological events) to estimate the time scale and assign absolute ages to internal nodes. | Does not require explicit time calibration. |
| Inference Method | Often constructed using molecular clock methods that estimate the rate of molecular evolution and use it to infer divergence times. | Can be constructed using various methods such as maximum likelihood, maximum parsimony, or distance-based methods. |
| Applications | Useful for studying evolutionary patterns, rates of molecular evolution, and estimating divergence times. | Commonly used for studying phylogenetic relationships, inferring ancestral states, and identifying evolutionary patterns. |
| Visual Representation | Often displayed with horizontal or diagonal lines indicating the time axis along the branches. | Typically displayed with branches of equal length, creating a symmetrical tree representation. |
| Example | A chronogram might show the estimated divergence times of different primate species, indicating when they branched off from a common ancestor. | A phylogram might show the genetic distances between different bird species, illustrating their evolutionary relationships based on genetic similarities. |
Phylogenetic Tree Construction Steps/How to Make a Phylogenetic Tree?
Here is the step by step process of construction of a Phylogenetic Tree;
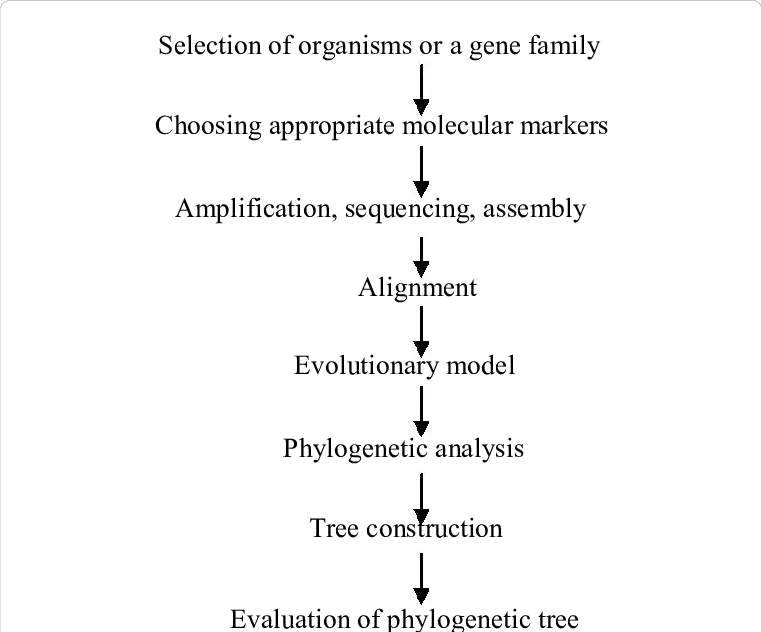
- Selection of molecular marker – it begins with choosing the right molecular marker, like nucleotide or protein sequences
- nucleotide sequences used for closely related organisms
- protein sequences preferred for distantly related taxa due to better conservation
- marker choice depends on study aim, sequence variability, evolutionary scale
- Multiple sequence alignment – sequences from different taxa are aligned to identify homologous regions
- high-quality alignment is critical, affects tree accuracy
- tools like T-Coffee or Gblocks used, Gblocks removes poorly aligned segments
- Selection of model of evolution – next step selects substitution model that explains sequence changes over time
- nucleotide models like Jukes-Cantor, Kimura 2-parameter
- amino acid models like Dayhoff (PAM), JTT
- model affects how evolutionary distances are calculated
- Construction of phylogenetic tree – tree built using methods classified as distance-based or character-based
- Distance-based – uses dissimilarity among sequences (e.g. Neighbor-Joining, UPGMA)
- Character-based – considers actual character states (e.g. Maximum Parsimony, Maximum Likelihood)
- Assessment of tree reliability – tree’s accuracy evaluated by bootstrapping or other resampling techniques
- bootstrapping resamples dataset to build multiple trees, checks branch support
- branches get bootstrap values (e.g. 95% support = high confidence)
- jackknifing and Bayesian simulation also used to validate topology
Phylogenetic Tree Construction Methods
The two main methods for constructing phylogenetic trees are the distance-based method and the character-based method.
- Distance-based methods – they rely on pairwise distance calculations between sequences
- UPGMA (Unweighted Pair Group Method with Arithmetic Mean) – assumes constant rate of evolution (molecular clock), builds rooted tree
- Neighbor-Joining (NJ) – doesn’t assume equal evolutionary rates, faster, builds unrooted tree
- Character-based methods – based on shared character states across sequences
- Maximum Parsimony (MP) – chooses tree with least evolutionary changes, simple but sensitive to homoplasy
- Maximum Likelihood (ML) – selects tree with highest probability under given model, statistically strong but computationally heavy
- Bayesian Inference – uses prior probability distributions, builds tree with posterior probability, needs MCMC simulation
- Other methods –
- Bootstrapping – not a tree building method but used to test tree reliability
- Consensus trees – summarize multiple tree topologies from bootstrapping or Bayesian outputs
- FastME, FastTree – optimized algorithms for large datasets, used in high-throughput pipelines
1. Distance-based methods
- Distance-based methods construct phylogenetic trees using pairwise distance matrices derived from sequence data. Distances reflect evolutionary divergence between sequences, calculated by substitution models
- Working principle –
- first align sequences, calculate genetic distances
- then use algorithms to cluster sequences based on minimum distances
- result is a tree where branch lengths show how much change occurred
- Common methods –
- UPGMA – assumes molecular clock (equal rate of evolution), produces rooted tree
- simple, fast, works best for clock-like data
- Neighbor-Joining (NJ) – no assumption of equal rates, gives unrooted tree
- widely used, accurate for various datasets, good balance of speed and precision
- UPGMA – assumes molecular clock (equal rate of evolution), produces rooted tree
- Advantages –
- computationally efficient, good for large datasets
- gives quick estimate of phylogeny
- Disadvantages –
- oversimplifies complex evolutionary patterns
- tree accuracy depends on quality of alignment and distance calculation
- less robust compared to model-based (likelihood or Bayesian) methods
2. Character-based methods
- Character-based methods infer phylogenetic trees by directly analyzing character states (like nucleotides or amino acids) at each site across aligned sequences. Instead of overall distances, it checks exact positions to trace shared ancestry
- Working principle –
- compares each character position across taxa
- evaluates possible tree topologies based on rules or probabilities
- selects the one that best explains observed character patterns
- Types –
- Maximum Parsimony (MP) – finds tree with fewest evolutionary changes
- favors simplicity, but sensitive to homoplasy and long-branch attraction
- Maximum Likelihood (ML) – uses statistical models to find tree with highest probability of observed data
- robust, accurate, handles complex models, but computationally intense
- Bayesian Inference – applies probability distributions to generate most likely tree using MCMC simulations
- provides posterior probabilities, needs prior assumptions, slow but powerful
- Maximum Parsimony (MP) – finds tree with fewest evolutionary changes
- Advantages –
- more accurate for complex evolutionary relationships
- uses detailed sequence info, supports statistical validation
- Disadvantages –
- computationally demanding, especially ML and Bayesian
- results sensitive to model assumptions and alignment errors
Differences between Distance-based methods and Character-based methods
| Feature | Distance-based Methods | Character-based Methods |
|---|---|---|
| Data used | Pairwise genetic distances | Individual character states (nucleotides/amino acids) |
| Example methods | UPGMA, Neighbor-Joining (NJ) | Maximum Parsimony (MP), Maximum Likelihood (ML), Bayesian Inference |
| Tree construction approach | Clustering based on overall similarity | Based on optimal explanation of character changes |
| Assumptions | Often assumes molecular clock (UPGMA) | Model-based (ML/Bayesian), or assumes minimal change (MP) |
| Speed | Fast, suitable for large datasets | Slower, especially ML and Bayesian methods |
| Accuracy | Lower, may miss evolutionary signals | Higher, captures complex patterns |
| Branch lengths | Reflect amount of genetic change | May reflect probability or number of changes (depends on method) |
| Model requirement | Simple models or none | Requires detailed substitution models (ML, Bayesian) |
| Sensitivity to homoplasy | Less sensitive | MP highly sensitive, ML/Bayesian more robust |
| Interpretability | Easier to compute and visualize | More complex, needs statistical understanding |
How to Read a Phylogenetic Tree?
Reading Phylogenetic trees is identical to reading family trees. However, we will explain in detail how to read a Phylogenetic tree.
Step 01: See the Root as Ancestor and Tips as Descendants
The root of the tree represents the ancestor from which all species have evolved. And the apex represents the species group (a portion of their common ancestry).

Step 02: See the Daughter Lineages
The second step is to identify the offspring lineages descended from the common ancestor. It divides into two or more branches that serve as a dividing line between one or more species.

Step 03: See the Shared Ancestry Between Lineages (If Any)
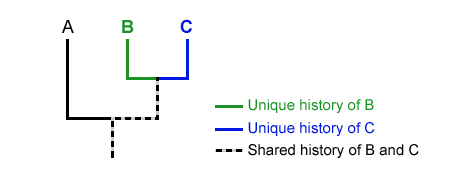
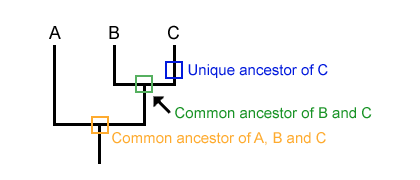
The third stage is to determine whether a group of species share any ancestry lineages. See points B and C in the following diagram. Point B and C have unique histories, unlike Point A.
Step 04: Read the Diagram as a Whole
See the figure below, and you should now be able to comprehend it in its entirety. The orange color indicates that Points A, B, and C share a common ancestor. However, the Green color indicates that Points B and C share a unique but common ancestor, and the same is true of Point C.
Importance of Phylogenetic Tree/Applications of the phylogenetic tree
- Understanding evolutionary relationships – it shows how species diverged from common ancestor, helps trace lineage n identify relatedness among organisms.
- Taxonomic classification – used to reorganize or validate taxonomy based on genetic similarity rather than just morphology or behavior.
- Predicting characteristics – by comparing unknown species to known ones, possible to infer traits, metabolic pathways, or host ranges.
- Identifying origin of pathogens – applied in epidemiology to trace outbreaks, determine source, and study how viruses or bacteria evolved over time.
- Drug target discovery – helps find conserved proteins or genes among pathogens which can be potential targets for vaccines or drugs.
- Conservation biology – assists in prioritizing species conservation by identifying evolutionarily distinct or ancient lineages.
- Study of gene function – used to infer function of newly discovered genes by examining evolutionary history with characterized homologs.
- Biogeography – supports reconstruction of historical migration or distribution patterns of organisms by linking phylogeny with geography.
- Forensic analysis – sometimes applied to identify unknown samples or trace origin of biological evidence.
- Analyzing horizontal gene transfer – helps detect unusual gene patterns that don’t match expected lineage due to gene transfer events.
Phylogenetic tree maker Tool
There are several software programs and online tools available for constructing phylogenetic trees. Here are some popular options:
- MEGA (Molecular Evolutionary Genetics Analysis) – it’s one of the oldest, still works great.. lets u align, build tree, visualize it, even test models
- Phylo.io – this’s web-based.. not much install needed, clean tree viewer, good for rooted/unrooted trees
- iTOL (Interactive Tree Of Life) – super visual tool.. supports large trees, color coding, annotations, and it looks cool
- NGPhylogeny.fr – runs whole pipeline.. u upload fasta, it aligns, builds, outputs tree.. works for lazy days
- Evolview – lets u edit and decorate trees.. export with color, icons, labels, legends, works for publication-style trees
- Dendroscope – this one’s for big trees.. handles 10k+ taxa, interactive zoom, split view.. kinda clunky but powerful
- Archaeopteryx – lightweight tool, simple GUI.. used often for educational trees, less for big genome ones
- FigTree – it’s made for viewing, editing phylogenies.. great for rooted trees, time trees, even layout tweaks
- T-REX – not the dino, lol.. it’s for distance matrices, tree inference, supports NJ, MP methods
- RAxML GUI – if ur into max likelihood, this GUI wraps the RAxML tool.. fast and good for big datasets
- Phylip – old school text-based toolset.. still useful, but need to know commands
- Clustal Omega (with EMBL-EBI Tree) – u align in Clustal, then click for tree view online.. not fancy but quick
- Geneious – it’s commercial, but has all-in-one tree builder with plugins, good interface
Terminology of phylogenetic trees
- Root – it’s where tree starts.. shows common ancestor of all included taxa
- Node – points where branches split.. could be ancestor or just divergence point
- Internal node – not the tips, but middle points.. they represent hypothetical ancestors
- Terminal node (Leaf or Tip) – actual observed species or sequences, found at end of branches
- Clade – group with a common ancestor + all its descendants.. also called monophyletic group
- Branch – lines connecting nodes.. length sometimes means genetic change, sometimes not
- Branch length – shows amt of change, mutation or time.. depends on tree type
- Outgroup – species added to root tree.. it’s outside main group, helps give direction
- Sister taxa – two descendants from same node.. closest relatives
- Monophyletic group – ancestor + all its descendants.. like a clean group
- Paraphyletic group – ancestor + some, not all descendants.. like reptiles without birds
- Polyphyletic group – unrelated species grouped without shared recent ancestor.. messy group
- Polytomy – node with more than two branches.. means uncertainty or quick divergence
- Ultrametric tree – all tips same distance from root.. often used in time trees
- Phylogram – branch lengths proportional to genetic change.. not time
- Chronogram – branch length = time.. calibrated with fossil or molecular clocks
- Topology – the branching structure only.. no lengths or time, just who’s related to who
- Unrooted tree – shows relationships, not ancestor.. more flexible but less directional
- Rooted tree – has defined common ancestor.. shows full path of evolution
- Consensus tree – built from multiple trees.. shows common parts, removes conflicts
- Bootstrap value – number near node, tells confidence in that branch.. higher = better
Limitations of phylogenetic tree
- Incomplete data —
data from fossils and extant species is always incomplete so trees are just hypotheses based on limited available info - Morphology pitfalls —
similar morphology doesn’t always mean relatedness, convergent evolution or different environments can make distantly related groups look alike - Genetic gene choice problems —
different genes evolve at different rates or are exchanged via horizontal transfer so gene trees may differ from species trees, some genes misleading about true organismal relationships - Homoplasy —
characters may arise independently in separate lineages, causing false similarity, which can mislead tree construction unless many independent traits are used. - Long branch attraction —
distantly related taxa with lots of change get grouped together erroneously, parsimony especially vulnerable, likelihood or Bayesian helps but not fully eliminates error. - Incomplete lineage sorting (ILS) —
ancestral polymorphism may persist through speciation so gene tree differs from species tree, causing discordance between gene and actual species history. - Polytomies and unresolved nodes —
when data insufficient you get soft polytomies (hard to resolve divergence order) maybe even true hard polytomies, multiple lineages diverged almost simultaneously. - Species sampling & low variation —
too few taxa included or low sequence variation reduces resolution, may drive erroneous speciation inference or weak support. - Terrace effects due to missing data —
missing loci across taxa create terraces of equally scoring trees, bootstrap may give high support to wrong clades, ambiguity in inference. - Pattern vs process limitation —
trees show patterns of relationship not processes of evolution, they can’t reveal mechanisms without combining with other data and experimental studies
Advantages of phylogenetic tree
- Organizes biodiversity —
it helps to arrange biological diversity into a nested hierarchy, letting us classify species based on evolutionary relationships, not just convenience, and thus makes classification more meaningful - Reveals evolutionary history —
it shows branching patterns of descent from common ancestors, giving insight into how lineages diverged over time, and it can include branch lengths to reflect amount or timing of evolution - Supports trait evolution studies —
helps examine how anatomical, molecular or physiological traits evolved across species, inferring ancestral states and correlated trait changes. - Enables comparative genomics —
gene and genome comparisons use phylogenetic trees to identify orthologs, paralogs, predict gene function by evolutionary context. - Enhances drug discovery & pharmacology —
related species may share pharmacologically useful traits, phylogenetic screening helps find organisms producing bioactive compounds like venoms or secondary metabolites. - Informs epidemiology & infection tracing —
phylogenetics of pathogen genomes reveals transmission dynamics and outbreak sources, aids public health response - Assists in conservation and biodiversity planning —
helps identify evolutionary distinct taxa and clades for conservation priority, understanding phylogenetic diversity and vulnerability - Predictive power for future evolution —
by learning patterns and common evolutionary mechanisms one can predict genomic or phenotypic change trends under selection or drift - Clarifies species boundaries and taxonomy —
by comparing DNA sequences, trees can improve or correct taxonomic placements beyond morphology alone, making taxonomy evolutionary‑based. - Visual communication of complex data —
trees are intuitive diagrams, helping scientists, students and stakeholders see relationships and complexity at a glance, even across big datasets.
Differences between a Phylogeny, an Evolutionary Tree, a Phylogenetic Tree, and a Cladogram
drawn from recent sources:
| Term | Definition & Use | Branch Lengths & Time | Depicts Evolutionary Process? | Notes |
|---|---|---|---|---|
| Phylogeny | Hypothesis of evolutionary relationships inferred from traits or genes; the study is phylogenetics | Not by itself, refers to concept | Underlies both tree types | It’s the overarching concept or history, not a diagram. |
| Evolutionary Tree | Generic term often used interchangeably with phylogenetic tree; represents lineage splits over time | Often shows time or divergence | Yes | A non‑technical label for a phylogeny diagram. |
| Phylogenetic Tree | Branching diagram representing evolutionary hypotheses; may be rooted or unrooted | Branch lengths can reflect time or change | Yes | Includes subtypes: phylogram (change) and chronogram (time) |
| Cladogram | Diagram of relationships based on shared derived traits (synapomorphies); focuses on branching order | Branch lengths arbitrary, no time | No | Doesn’t show ancestor‑descendant change magnitude, only topology. |
Phylogenetic tree vs cladogram
| Aspect | Phylogenetic Tree | Cladogram |
|---|---|---|
| Purpose & Interpretation | Shows evolutionary relationships with time or genetic distances, often indicating branching times or amount of change | – Displays only branching order (topology) based on shared derived traits (synapomorphies), with no time or distance scale |
| Branch Lengths | – Branch lengths may be proportional to genetic change (phylogram) or to time (chronogram) | – Branch lengths are arbitrary; they carry no information on evolutionary change or timing |
| Temporal Information | – Often rooted and calibrated to show divergence times or ancestral lineage depth | – No temporal calibration or ancestor‑descendant durations implied |
| Data Basis | – Often built using molecular data (DNA/RNA) and morphological traits; may use model‑based inference | – Based strictly on shared derived traits (synapomorphies), often from morphology or combined data |
| Node Meaning | – Internal nodes typically represent inferred common ancestors with evolutionary significance | – Nodes represent branching patterns only, not necessarily ancestral entities |
| Evolutionary Process Info | – Can reflect evolutionary rates, temporal sequence, divergence magnitude | – Focused purely on relationship topology; process magnitude and timing absent |
Phylogenetic Tree Example
1. Animal Phylogenetic Tree
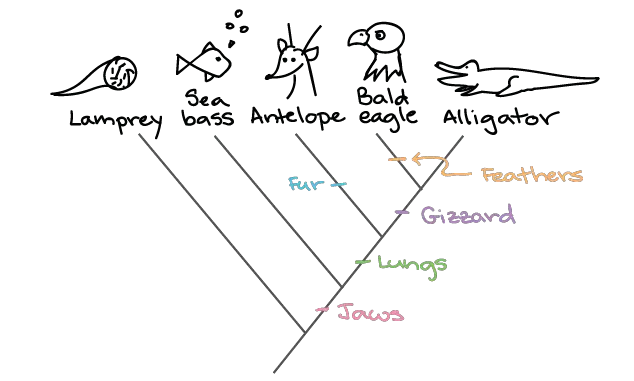
A simple phylogenetic tree illustrating evolutionary relationships among different animals (lamprey, sea bass, antelope, bald eagle, alligator), with trait‐mapping (jaws, lungs, fur, gizzard, feathers) placed along branches.
Here’s how to interpret it:
- Lamprey, at the base, is jawless so it branches before the “jaws” trait appears
- A transition higher up shows jaws, after which sea bass and others share that trait
- Then lungs appears before the branch leading to antelope, eagle, alligator
- Fur appears only on the lineage leading to antelope (mammals), absent in birds and reptiles
- Gizzard, indicated on the branch that leads to the bald eagle (a bird trait)
- Feathers appear right before the bald eagle branch, denoting bird‐specific trait evolution
So the tree shows:
- shared derived traits appear on internal branches
- each node indicates a common ancestor where a new trait evolved
- sequence of character acquisitions: jaws → lungs → fur or gizzard → feathers
Key takeaways:
- lamprey lacks jaws, lungs—ancestral
- sea bass has jaws but not lungs/fur/gizzard/feathers
- antelope has later mammalian traits such as lungs and fur
- bald eagle has avian traits: gizzard then feathers
- alligator shares jaws and lungs but lacks mammalian or avian derived traits
2. Plant Phylogenetic Tree
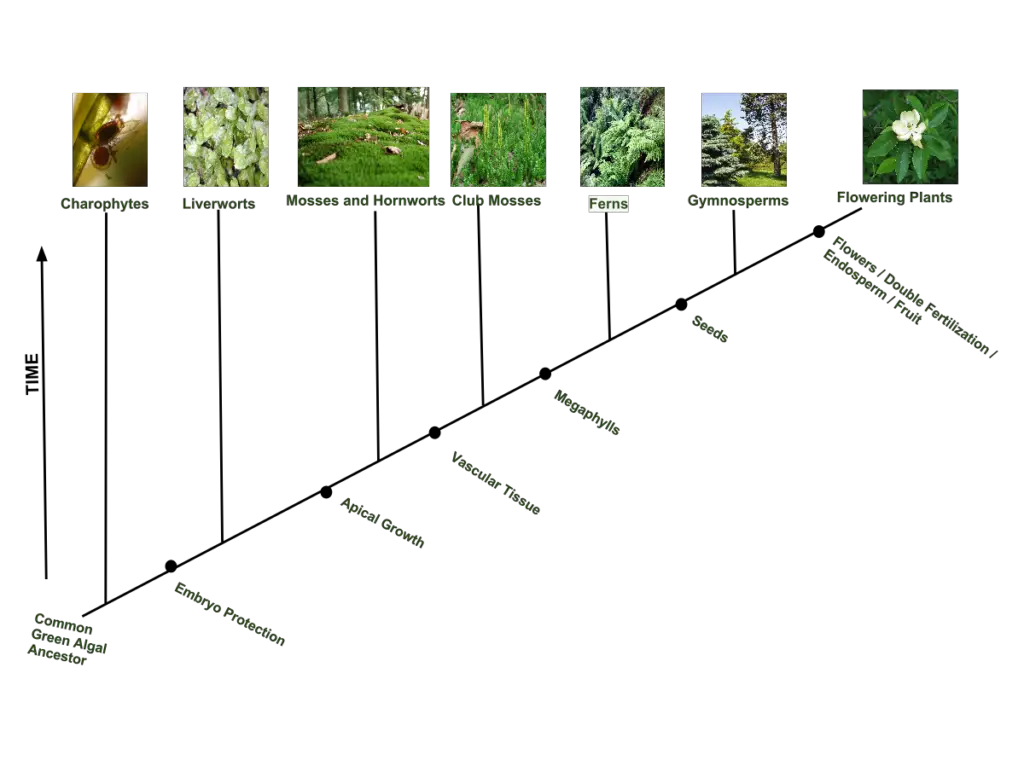
This image shows a plant phylogenetic tree starting from a common green algal ancestor, tracing the evolution of modern land plants through key innovations. Here’s how to read and interpret it:
- Charophytes –
basal lineage, closest to green algae; lacks land adaptations - Liverworts –
first lineage to branch off after acquiring embryo protection, an early land adaptation - Mosses and Hornworts –
share apical growth, allowing upright body plan and tissue development - Club Mosses –
earliest plants in this tree with vascular tissue, enabling transport of water & nutrients - Ferns –
represent plants with megaphylls (true leaves), increasing photosynthetic efficiency - Gymnosperms –
evolved seeds, an important reproductive advance for survival on land - Flowering Plants (Angiosperms) –
final major lineage, with innovations like flowers, double fertilization, endosperm, and fruits for reproductive success and seed dispersal
Key Trait Progression along tree (left → right):
- Embryo protection
- Apical growth
- Vascular tissue
- Megaphylls (broad leaves)
- Seeds
- Flowers, Double Fertilization, Fruit
Each innovation marks a branch point (node), indicating a shared derived trait that evolved and passed on to all descendants from that point forward.
This tree tells you:
- Charophytes are aquatic ancestors
- Bryophytes (liverworts, mosses, hornworts) are non‑vascular
- Vascular plants evolve from club mosses onwards
- Seed plants emerge from gymnosperms onward
- Flowering plants are the most recently derived group
3. Bacterial Phylogenetic Tree
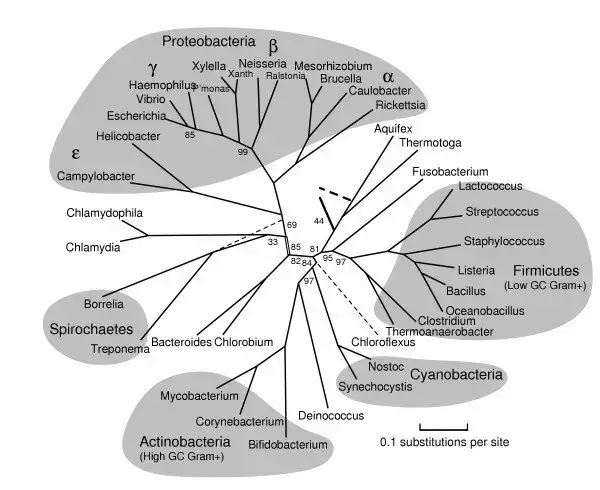
This is a bacterial phylogenetic tree showing evolutionary relationships among major bacterial lineages based on molecular sequence data (probably 16S rRNA or similar).
Here’s how to interpret it:
- Tree Type –
It’s a rooted phylogenetic tree, with branch lengths scaled to substitutions per site (evolutionary distance); scale bar indicates 0.1 substitutions/site. - Major Clades (Shaded groups) –
the tree clusters bacteria into major phyla or groupings, each shaded and labeled:- Proteobacteria (α, β, γ, δ, ε classes)
- includes Escherichia, Vibrio, Helicobacter, Rickettsia, etc.
- highly diverse Gram‑negative lineage
- Firmicutes (Low GC Gram+)
- includes Bacillus, Clostridium, Staphylococcus, Streptococcus
- mostly Gram-positive with low GC content
- Actinobacteria (High GC Gram+)
- includes Mycobacterium, Corynebacterium, Bifidobacterium
- Gram-positive, high GC content
- Spirochaetes
- Treponema, Borrelia, spiral‑shaped bacteria
- Cyanobacteria
- Nostoc, Synechocystis, oxygenic photosynthesis
- Chlamydiae
- Chlamydia, Chlamydophila, obligate intracellular
- Thermophilic lineages
- Thermotoga, Aquifex, among most ancient/extreme lineages
- Green Non‑Sulfur (Chloroflexus)
- unique phototrophs
- Deinococcus
- radiation‑resistant bacteria
- Bacteroidetes/Chlorobi group
- includes Bacteroides (gut bacteria)
- Proteobacteria (α, β, γ, δ, ε classes)
- Bootstrap values shown at some nodes (e.g. 85, 99, 44)
- values close to 100 indicate high support for that clade’s placement
- dashed lines indicate lower support or uncertain branching
- Interpretation –
organisms that branch closer together (shorter path) are more closely related
major evolutionary divergences marked by long internal branches
e.g., E. coli and Vibrio are γ‑proteobacteria and more related to Haemophilus than to Staphylococcus (Firmicute) - Other features
- The root may lie near Aquifex/Thermotoga—deep branching thermophiles
- Deinococcus branches separately, known for unusual resistance
This tree reflects broad bacterial phylogeny used in microbial taxonomy and molecular systematics.
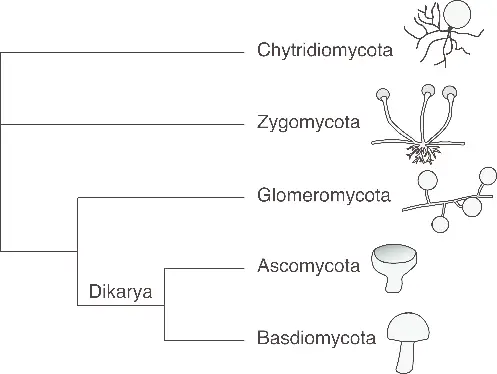
4. Fungal Phylogenetic Tree
This image shows a fungal phylogenetic tree, illustrating evolutionary relationships among major fungal phyla. It’s simplified, using branching topology to represent divergence among clades.
Here’s how to read it:
- Chytridiomycota
- Early diverging fungi; mostly aquatic
- Unique feature: flagellated spores (zoospores)
- Considered the most basal fungal group
- Zygomycota
- Include common bread molds (Rhizopus)
- Form zygosporangia in sexual reproduction
- Once grouped together, but now known to be polyphyletic, often reclassified
- Glomeromycota
- Form arbuscular mycorrhizae with plant roots
- Obligate symbionts
- Critical for plant nutrient uptake and evolution of land plants
- Dikarya (clade)
- Includes both Ascomycota and Basidiomycota
- Named for having a dikaryotic stage (two nuclei per cell during part of life cycle)
- Ascomycota
- “Sac fungi”, includes yeasts, Penicillium, Neurospora, truffles
- Form ascospores inside asci
- Most diverse fungal phylum
- Basidiomycota
- “Club fungi”, includes mushrooms, puffballs, rusts
- Produce basidiospores on basidia
- Important decomposers and plant pathogens
Tree Interpretation Summary:
- Shows gradual divergence from basal to derived fungi
- Chytrids are earliest branch, retain ancestral flagellum
- Zygomycetes and Glomeromycota diverge after
- Dikarya is most derived group, includes the two large phyla with complex fruiting bodies
This phylogeny is based on molecular data (e.g., rRNA, protein-coding genes) and reflects both reproductive traits and evolutionary history.
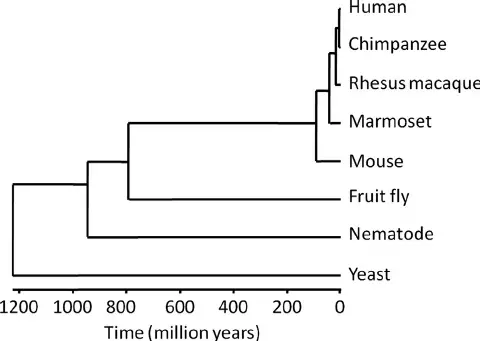
5. Human phylogenetic tree
This is a time-calibrated human phylogenetic tree (chronogram), showing evolutionary relationships between humans and several other model organisms, with divergence times marked along the X-axis (in millions of years ago).
Here’s how to read and interpret it:
- X-axis = Time (MYA)
- 0 MYA = present time
- Tree goes back to ~1200 million years ago
- Horizontal distance between nodes = time since divergence
- Branching Order (From oldest split to most recent):
- Yeast
- Earliest divergence; single-celled eukaryote
- Split from the animal lineage ~1200 MYA
- Nematode (e.g., C. elegans)
- Early-branching animal lineage
- Diverged from common ancestor of fruit flies and vertebrates ~900–1000 MYA
- Fruit Fly (Drosophila)
- Invertebrate model, diverged from vertebrates ~800–850 MYA
- Mouse
- First mammalian lineage in this tree
- Diverged from primates ~90–100 MYA
- Marmoset
- New World monkey
- Split from Old World monkeys (rhesus, chimpanzee, human) ~40 MYA
- Rhesus Macaque
- Old World monkey
- Diverged from great apes ~25–30 MYA
- Chimpanzee
- Closest relative to humans
- Diverged ~6–7 MYA
- Human
- Most recent branch; modern species
- Yeast
Key Interpretations:
- Human and chimpanzee share the most recent common ancestor
- Mouse is closer to humans than flies, worms, or yeast
- Tree reflects both molecular phylogeny and evolutionary timescales
- Used widely in comparative genomics, model organism studies, and understanding conserved gene functions
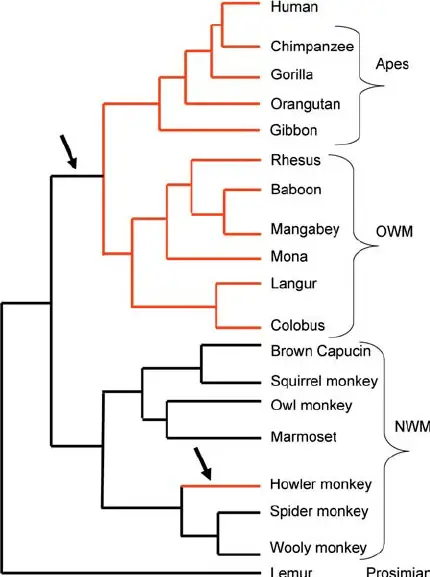
6. Primate phylogenetic tree
This is a primate phylogenetic tree, showing the evolutionary relationships among different groups of primates including apes, monkeys, and prosimians.
Here’s how to interpret it:
- Clade 1: Apes (highlighted in red, uppermost group)
- Includes: Human, Chimpanzee, Gorilla, Orangutan, Gibbon
- Form the hominoids, part of the Catarrhini clade
- Share recent common ancestor; closest relatives to humans
- Clade 2: Old World Monkeys (OWM)
- Includes: Rhesus, Baboon, Mangabey, Mona, Langur, Colobus
- All OWM are Catarrhines, like apes, but diverged earlier
- Live in Africa/Asia; narrow-nosed primates
- Clade 3: New World Monkeys (NWM)
- Includes: Brown Capucin, Squirrel Monkey, Owl Monkey, Marmoset, Howler Monkey, Spider Monkey, Wooly Monkey
- All NWM are Platyrrhines – flat-nosed monkeys
- Diverged from Old World lineages earlier
- Clade 4: Prosimians (basal branch)
- Lemur represents this primitive group
- First to diverge from rest of primate tree
- Include lemurs, lorises, tarsiers
Key Evolutionary Highlights:
- First black arrow (lower) marks divergence between Prosimians and Anthropoids (monkeys + apes)
- Second black arrow (upper) marks the split between New World Monkeys (NWM) and Old World Monkeys (OWM) + Apes
Branch Order Summary:
- Lemur (Prosimians) — earliest divergence
- NWM (Platyrrhines) — second divergence
- OWM and Apes (Catarrhines) — more recently evolved
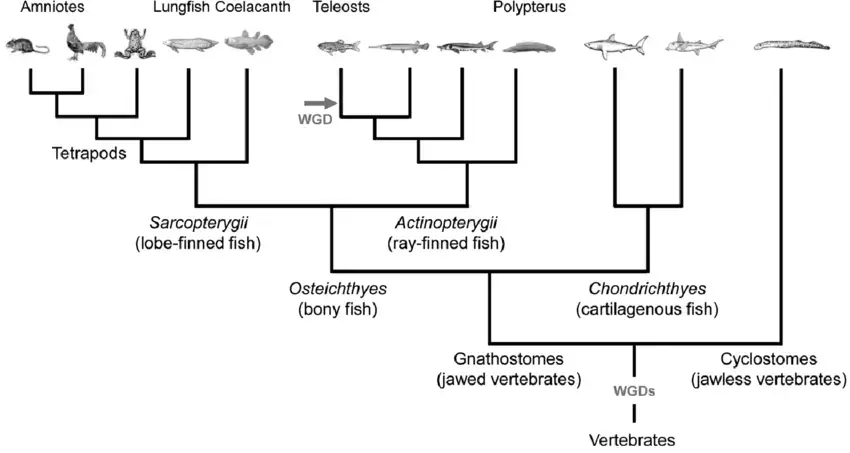
7. Vertebrate phylogenetic tree
- Vertebrates –
- all members here evolved from common ancestral chordates, then branched into two primary clades
- Cyclostomes (Jawless vertebrates) –
- jawless fishes, like lampreys, hagfish, no true jaws or paired appendages
- diverged early, before major vertebrate innovations
- Gnathostomes (Jawed vertebrates) –
- includes most modern vertebrates, evolved jaws and paired fins
- underwent two whole genome duplications (WGD), boosting genetic complexity
- Chondrichthyes (Cartilaginous fishes) –
- sharks, rays, skates, skeleton made of cartilage
- one of the oldest jawed fish lineages still alive
- Osteichthyes (Bony fishes) –
- defined by ossified skeleton, divided into two major subgroups
- Actinopterygii (Ray-finned fishes) –
– dominant aquatic vertebrates today, fins supported by bony rays
– includes teleosts, polypterus, extremely diverse group
– underwent a third WGD, unique to teleosts
- Sarcopterygii (Lobe-finned fishes) –
– fleshy, lobed paired fins with internal bones
– gave rise to lungfish, coelacanths, and eventually tetrapods
- Tetrapods (4-limbed vertebrates) –
- evolved limbs from lobe fins, colonized land
- lungs evolved earlier in sarcopterygians, used here for breathing air
- Amniotes –
– evolved amniotic egg, helped survive dry land
– includes reptiles, birds, mammals
- Key Evolutionary Events –
- jaws appeared after divergence from cyclostomes
- paired fins, ossified skeleton, lungs, limbs added successively
- three rounds of WGD—2 basal vertebrate WGDs, 1 in teleosts
- Tree Interpretation Summary –
- vertebrate evolution was stepwise, innovations stacked gradually
- teleosts and tetrapods are more derived, jawless fishes more basal
- all modern vertebrates trace back to common ancestor, over 500 mya
- lobe-finned lineage crucial for land vertebrate emergence
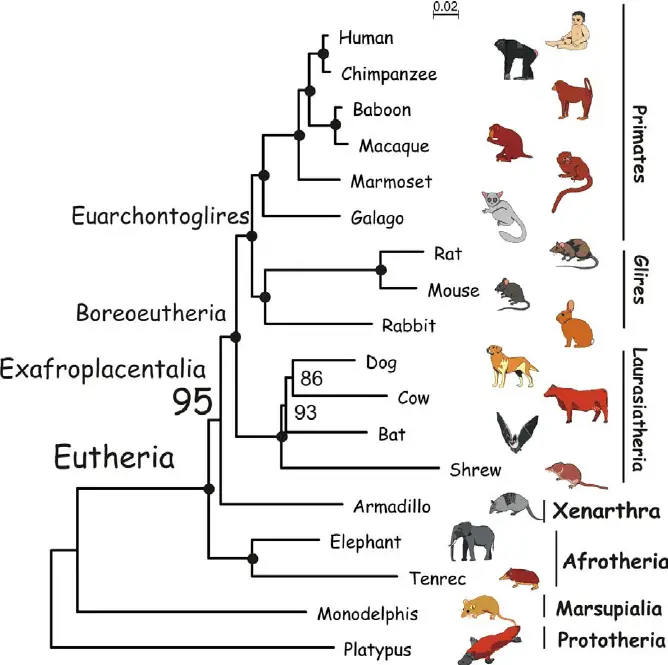
8. Phylogenetic tree mammals
- Eutheria (Placental mammals) –
- all placental mammals grouped here, diverged from marsupials and monotremes
- tree shows multiple clades under Eutheria
- Exafroplacentalia –
- major split from Afrotheria and Xenarthra
- includes Boreoeutheria, which further divides
- Afrotheria –
- includes Elephant and Tenrec
- mostly African origin mammals, early diverging lineage
- Xenarthra –
- includes Armadillo
- unique vertebral articulations, mostly South American
- Boreoeutheria –
- large clade including rodents, primates, bats, carnivores, hoofed mammals
- Euarchontoglires –
– includes Primates + Glires
- Primates –
– Human, Chimpanzee, Baboon, Macaque, Marmoset, Galago
– human lineage closest to chimp, then baboon/macaque
– galago basal to other primates
- Glires –
– Rat, Mouse, Rabbit
– rodents and lagomorphs (rabbit) grouped here
– mouse and rat closely related
- Laurasiatheria –
– includes Dog, Cow, Bat, Shrew
– dog–cow clade has high bootstrap (86–93) support
– bats diverged early from rest of this clade
– shrew is basal to other laurasiatherians
- Outgroup Mammals –
- Monodelphis (marsupial) and Platypus (monotreme)
- diverged before eutherians
- marsupials give live birth but with pouch
- monotremes lay eggs
- Phylogenetic Insight Summary –
- humans closer to chimps than macaques, as expected
- rodents + rabbits grouped under Glires, sister to primates
- Afrotheria and Xenarthra branched early, before Boreoeutheria expanded
- tree uses genetic distance (scale bar = 0.02 substitutions/site)
- support values (e.g., 95) indicate robust node confidence
Phylogenetic tree practice
- Which evolutionary concept is represented by the branch points in a phylogenetic tree?
- How are the lengths of branches in a phylogenetic tree typically interpreted?
- What is the purpose of using outgroup taxa in phylogenetic tree construction?
- How does the use of different algorithms (e.g., maximum likelihood, maximum parsimony) affect the construction of phylogenetic trees?
- What is the difference between a polytomy and a resolved branch in a phylogenetic tree?
- How can the bootstrap value or posterior probability be used to assess the support for a specific branch in a phylogenetic tree?
- Why is it important to consider multiple lines of evidence, such as molecular data and morphological traits, when constructing a phylogenetic tree?
- Explain the concept of convergent evolution and how it can influence the interpretation of phylogenetic trees.
- How can phylogenetic trees help in understanding the origins and evolutionary relationships of specific traits or adaptations?
- Discuss the challenges and limitations of inferring phylogenetic relationships when dealing with incomplete or ambiguous data.
FAQ
What is a phylogenetic tree?
A phylogenetic tree is a diagrammatic representation of the evolutionary relationships among different organisms or sequences. It illustrates the branching patterns and common ancestry of species or genes.
How are phylogenetic trees constructed?
Phylogenetic trees are constructed using various methods, such as maximum likelihood, maximum parsimony, or distance-based algorithms. These methods analyze genetic or morphological data to infer evolutionary relationships.
What is the purpose of a phylogenetic tree?
Phylogenetic trees help us understand the evolutionary history, relatedness, and diversification of organisms. They provide insights into the patterns of evolutionary change and can be used to study various biological phenomena.
What do the branches and nodes represent in a phylogenetic tree?
The branches in a phylogenetic tree represent evolutionary relationships and show the divergence of lineages. Nodes, or branch points, represent common ancestors from which different lineages have evolved.
How are branch lengths interpreted in a phylogenetic tree?
Branch lengths in a phylogenetic tree can represent different factors, such as genetic distance, time, or evolutionary change. Longer branches typically indicate more divergence or greater genetic differences between taxa.
What is the difference between a cladogram and a phylogenetic tree?
A cladogram is a type of phylogenetic tree that represents only the branching pattern of relationships, without indicating branch lengths or time scales. A phylogenetic tree includes additional information such as branch lengths and can provide more detailed insights into evolutionary history.
How can I interpret the support values in a phylogenetic tree?
Support values, such as bootstrap values or posterior probabilities, indicate the statistical support for specific branches or nodes in a phylogenetic tree. Higher support values suggest more confidence in the inferred relationships.
Can phylogenetic trees be used to study human evolution?
Yes, phylogenetic trees are commonly used to study human evolution. They help trace the evolutionary relationships among different hominid species and shed light on the origins and diversification of our lineage.
What are the limitations of phylogenetic trees?
Phylogenetic trees are based on available data and assumptions, so they can be affected by data quality, incomplete sampling, or inaccuracies in the underlying models. Additionally, the interpretation of tree topologies can sometimes be challenging due to complex evolutionary processes.
How can phylogenetic trees inform conservation biology?
Phylogenetic trees can help identify evolutionary distinct species, prioritize conservation efforts based on genetic diversity, and understand the evolutionary origins and relationships of endangered or threatened species.
Which type of evidence is least likely to result in changes to a phylogenetic tree?
The type of evidence that is least likely to result in changes to a phylogenetic tree is strong and well-supported evidence from multiple independent sources. When multiple lines of evidence consistently support a particular phylogenetic tree topology, it becomes more robust and less likely to change.
For example, if different types of data, such as molecular sequences, morphological characteristics, and fossil records, all consistently support the same phylogenetic relationships, it provides a strong foundation for the tree’s accuracy. In such cases, it becomes less likely that new evidence or analysis will drastically alter the overall tree topology.
On the other hand, if the evidence is weak, conflicting, or based on a single source, there is a higher probability of changes to the phylogenetic tree as new data becomes available or alternative analytical methods are applied. In such cases, further research, increased sampling, or the incorporation of additional data can lead to revisions or refinements in the phylogenetic relationships.
- Phylogenetic Trees and Geologic Time | Organismal Biology. (n.d.). https://organismalbio.biosci.gatech.edu/biodiversity/phylogenetic-trees/
- Chouvalova, A., & Limeri, L. (2023, January 11). Chapter 8: Reading Phylogenetic Trees. Introductory Biology 2. https://raider.pressbooks.pub/biology2/chapter/9-reading-phylogenetic-trees/
- Embl-Ebi. (n.d.). Why is phylogenetics important? | Phylogenetics. https://www.ebi.ac.uk/training/online/courses/introduction-to-phylogenetics/why-is-phylogenetics-important/
- National Research Council (US); Avise JC, Hubbell SP, Ayala FJ, editors. In the Light of Evolution: Volume II: Biodiversity and Extinction. Washington (DC): National Academies Press (US); 2008. 14, Phylogenetic Trees and the Future of Mammalian Biodiversity. Available from: https://www.ncbi.nlm.nih.gov/books/NBK214880/
- Munjal G, Hanmandlu M, Srivastava S. Phylogenetics Algorithms and Applications. Ambient Communications and Computer Systems. 2018 Dec 10;904:187–94. doi: 10.1007/978-981-13-5934-7_17. PMCID: PMC7123334.
- Nadler SA. Advantages and disadvantages of molecular phylogenetics: a case study of ascaridoid nematodes. J Nematol. 1995 Dec;27(4):423-32. PMID: 19277308; PMCID: PMC2619635.
- Young, A. D., & Gillung, J. P. (2019). Phylogenomics — principles, opportunities and pitfalls of big‐data phylogenetics. Systematic Entomology, 45(2), 225–247. https://doi.org/10.1111/syen.12406
- Dees, J., Momsen, J. L., Niemi, J., & Montplaisir, L. (2014). Student Interpretations of Phylogenetic trees in an introductory Biology course. CBE—Life Sciences Education, 13(4), 666–676. https://doi.org/10.1187/cbe.14-01-0003
- Singer, E. (2013, June 7). New algorithms force scientists to revise the tree of life. WIRED. https://www.wired.com/2013/06/algorithms-revise-tree-of-lif/
- LibGuides: Biology 1012 K Lab Manual: 2. Phylogenetic Tree. (n.d.). https://getlibraryhelp.highlands.edu/c.php?g=1286245&p=9445018
- Soltis DE, Soltis PS. The role of phylogenetics in comparative genetics. Plant Physiol. 2003 Aug;132(4):1790-800. doi: 10.1104/pp.103.022509. PMID: 12913137; PMCID: PMC526274.
- Phylogenetic trees and monophyletic groups | Learn Science at Scitable. (n.d.). https://www.nature.com/scitable/topicpage/reading-a-phylogenetic-tree-the-meaning-of-41956/
- Phylogenetic trees | Evolutionary tree (article) | Khan Academy. (n.d.). Khan Academy. https://www.khanacademy.org/science/biology/her/tree-of-life/a/phylogenetic-trees
- Cladograms & Phylogenetic Trees | Overview & Differences – Lesson | Study.com. (n.d.). study.com. https://study.com/academy/lesson/cladograms-and-phylogenic-trees-evolution-classifiations.html
- What is the difference between phylogenetics and cladistics? : r/Paleontology. (n.d.). https://www.reddit.com/r/Paleontology/comments/auynl5/what_is_the_difference_between_phylogenetics_and/
- Cladograms & Phylogenetic Trees | Overview & Differences – video | Study.com. (n.d.). study.com. https://study.com/academy/lesson/video/cladograms-and-phylogenic-trees-evolution-classifiations.html
- Phylogeny – AP Biology Study Guide. (2025, February 26). Save My Exams. https://www.savemyexams.com/ap/biology/college-board/20/revision-notes/unit-7-natural-selection/evolutionary-theory/phylogeny/
- Reading trees: A quick review. (n.d.). https://evolution.berkeley.edu/phylogenetic-systematics/reading-trees-a-quick-review/
- Mihindukulasuriya, H., & Creately. (2024, July 3). Cladograms vs Phylogenetic Trees: Key Differences Explained. Creately. https://creately.com/guides/cladogram-vs-phylogenetic-tree/
- Wikipedia contributors. (2025, July 17). Cladistics. Wikipedia. https://en.wikipedia.org/wiki/Cladistics
- Boudreau, S. (n.d.). Phylogenetic trees, cladograms, and how to read them. https://www.visiblebody.com/blog/phylogenetic-trees-cladograms-and-how-to-read-them
- Wikipedia contributors. (2025, July 18). Phylogenetics. Wikipedia. https://en.wikipedia.org/wiki/Phylogenetics
- Reading trees: A quick review. (n.d.). https://evolution.berkeley.edu/phylogenetic-systematics/reading-trees-a-quick-review/
- Text Highlighting: Select any text in the post content to highlight it
- Text Annotation: Select text and add comments with annotations
- Comment Management: Edit or delete your own comments
- Highlight Management: Remove your own highlights
How to use: Simply select any text in the post content above, and you'll see annotation options. Login here or create an account to get started.