IB Biology 26 Views 1 Answers
Sourav PanLv 9November 8, 2024
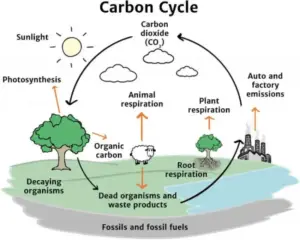
How can a diagram of the carbon cycle be constructed to accurately represent carbon flows?
How can a diagram of the carbon cycle be constructed to accurately represent carbon flows?
Please login to save the post
Please login to submit an answer.
Sourav PanLv 9May 15, 2025
To construct a diagram of the carbon cycle that accurately represents carbon flows, it’s essential to include the various processes and reservoirs involved in the cycle. Here’s a step-by-step guide to creating a comprehensive carbon cycle diagram, along with an explanation of its importance.
Steps to Construct a Carbon Cycle Diagram
1. Identify Key Components
- Reservoirs: Include major carbon reservoirs such as:
- Atmosphere (CO₂)
- Terrestrial biosphere (plants, soil organic matter)
- Oceans (dissolved CO₂, marine organisms)
- Fossil fuels (coal, oil, natural gas)
- Sedimentary rocks (limestone, carbonates)
- Processes: Highlight the key processes that move carbon between these reservoirs:
- Photosynthesis: Plants absorb CO₂ from the atmosphere and convert it into organic matter.
- Respiration: Both plants and animals release CO₂ back into the atmosphere through respiration.
- Decomposition: Microorganisms break down dead organic matter, releasing CO₂.
- Combustion: Burning fossil fuels and biomass releases CO₂ into the atmosphere.
- Ocean Uptake: Oceans absorb atmospheric CO₂ and incorporate it into marine organisms or sediments.
- Sedimentation: Accumulation of organic matter in sediments can lead to fossil fuel formation over geological time.
2. Draw the Diagram
- Use arrows to represent carbon flows between reservoirs. The thickness of arrows can indicate the magnitude of carbon movement.
- Label each component clearly, indicating whether it is a reservoir or a process.
- Consider using colors to differentiate between natural processes (like photosynthesis and respiration) and human-induced processes (like combustion).
3. Incorporate Quantitative Data
- If available, include approximate values for carbon fluxes associated with each process. For example:
- Annual photosynthesis might sequester approximately 120 gigatons of carbon.
- Fossil fuel combustion could release around 10 gigatons of carbon annually.
4. Highlight Feedback Mechanisms
- Indicate any feedback loops that may exist within the system, such as how increased atmospheric CO₂ can enhance plant growth (carbon fertilization) but also contribute to climate change.
5. Use a Clear Layout
- Ensure that the diagram is not cluttered. Group related processes and reservoirs together to enhance readability.
Importance of the Carbon Cycle Diagram
- Visual Representation:
- A diagram provides a clear visual representation of complex interactions within the carbon cycle, making it easier for students and researchers to understand how carbon moves through different systems.
- Educational Tool:
- It serves as an educational resource for teaching about climate change, ecosystem dynamics, and biogeochemical cycles. Understanding these concepts is critical for fostering awareness about environmental issues.
- Research and Policy Development:
- Researchers can use diagrams to communicate findings related to carbon fluxes and their implications for climate policy. Policymakers can visualize how different activities impact carbon levels and make informed decisions based on this understanding.
- Monitoring Changes:
- Tracking changes in the carbon cycle over time through updated diagrams can help scientists monitor the effects of climate change and human activities on global carbon levels.
- Interdisciplinary Connections:
- The diagram connects various scientific disciplines such as biology, geology, meteorology, and environmental science, highlighting the interconnectedness of Earth systems.

0
0 likes
- Share on Facebook
- Share on Twitter
- Share on LinkedIn
0 found this helpful out of 0 votes
Helpful: 0%
Helpful: 0%
Was this page helpful?


